The major ingredients present in synthetically manufactured fertilizers include various types of compounds containing nitrogen (N), and potassium (K), phosphorous (P) and potassium (K), Granular fertilizer containing all three is identified as NPK. These fertilizers are used to supply nutrients for half the world’s food consumption.
Examples of the numerous synthetic fertilizers include potassium chloride (KCl) and di-ammonium phosphate (DAP). While a majority of fertilizer manufacturing processes produce solid “round” granules in the 2 to 4 mm range or the 1 to 6 mm range, the primary feedstock to the process is in liquid form, known as the “Melt.” A frequently used Drum Granulation process is illustrated in Figure 1.
The Process
Drum Granulation
The Melt enters via the drum granulator’s front end which rotates, and with the help of lifters present along the inner side of the drum, it gently throws the granules as they grow in size. The exit stream has granules ranging from 0.1 to 10 mm in size. The stream is monitored for granules at 4 mm, with +4 mm granules sent to a large silo from which they pass via a roll crusher and then back into the drum granulator.
The -4 mm stream is monitored for granules at 2 mm, with the -2 mm stream sent to an under-size silo and then back into the drum granulator. The ensuing product is the 4 x 2-mm stream which makes up approximately 1/3 of the whole process stream at any specific time.
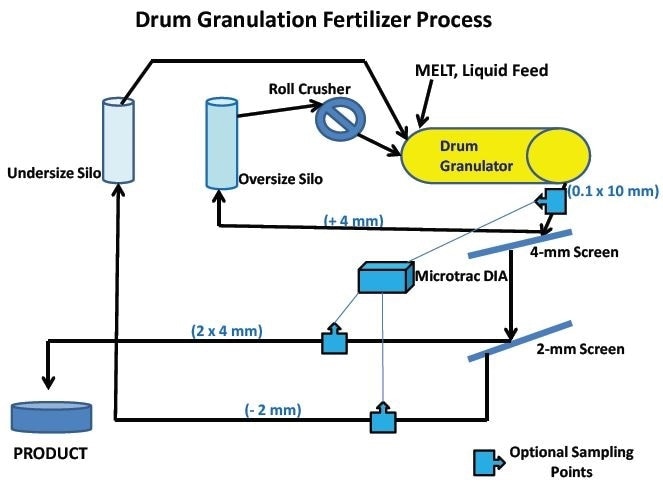
Figure 1. Flow diagram of typical drum granulation fertilizer manufacture. Optional sampling points to bring sample to an online PartAn for measuring particle sizes and shapes are shown. There are several variations of this basic process for synthetic compound fertilizers. Some descriptions follow: move to main text below.
Pan Granulation swaps a pan (saucer-shaped) granulator for the drum granulator.
Prilling presents a liquid mixer in which the undersize silo stream dissolves before returning to the granulation process, which is a prilling tower in this case. The prilling tower is tall vertical and is fed with granules by a rotating funnel-shaped container with holes in it. The funnel is then fed with the Melt and the dissolved undersize stream. A column of air comes through the prilling tower, causing the melt and stream to drop to the bottom as near dry granules, after which they are sent through the 4 mm screen. The +4 mm stream travels directly to the roll crusher and then to the undersize silo.
The +4 mm and the -2 mm streams are recycled using nozzle spraying to a mixer for dissolution in oil. These dissolved streams, along with the liquid Melt, are sent to sets of nozzles near the top of a tall tower. These nozzles spray the joint feed streams in an upward direction, and the droplets then drop through a column of air which is supplied up through the tower akin to the prilling process.
In Fluid Bed processing, a fluid bed unit operation is used in place of the drum granulator for manufacturing the granules that are then screened.
The lesser-used processes are Crystallization, Spheroidization, and Pug Milling, which can also substitute the drum granulator and create a narrowly sized stream of “round” granules.
The Problem
The granules are coated with a thin wax layer, which is a very crucial finishing step in all these processes as this controls the leaching rate once the fertilizer has been applied to crop fields. It is because of this reason that the granules have to be a narrow size distribution and as round and consistently smooth as possible. Particles with uneven shapes are more like fused globules than round granules; they probably will break at the narrower points, exposing surfaces without coating, and can be hard to coat evenly over the whole surface.
The Solution
Image Analysis, a particle characterization method, provides extra information and thus, it is progressively being used instead of other traditional approaches. Typically, only a single particle size is measured, either the particle volume distribution, such as electrical sensing zone (ESZ), or the equivalent spherical diameter (ESD) distribution, such as sieve analysis, laser diffraction, and sedimentation. On the other hand, Image Analysis offers up to 24 different size and shape morphological parameters for each particle measured. This technology can provide size, roundness, and surface roughness data relating to the product, enabling all these properties to be measured and controlled with a single analyzer for applications like improving control of fertilizer manufacturing.
On-Line Analysis
On-line Image Analyzers have been used in fertilizer plants around the world since the preliminary installation in 1988. The PartAn analyzer, which offers an extended operation without failure, is illustrated in the following figure.
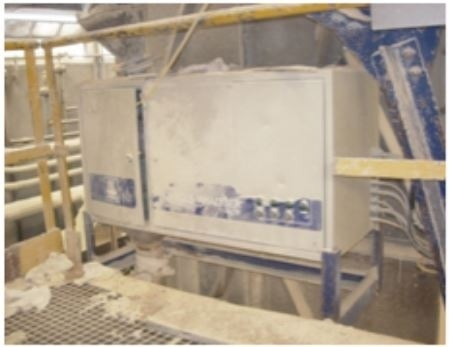
Figure 2. Online image analyzer in a fertilizer plant, working continuously since 1995 without service
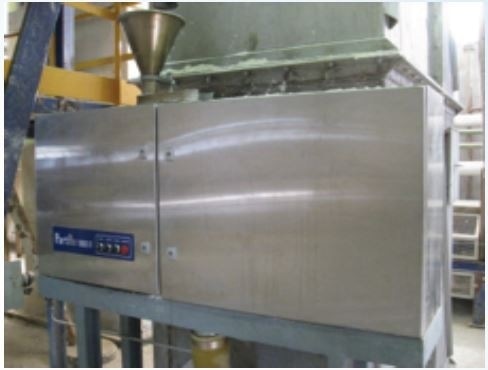
Figure 2a. On-line version of PartAn being installed Dec 2011
The benefits of on-line control of a process versus lab control are revealed in the graphs below (Figure 3). The top graph illustrates the long time taken between sampling and analysis when using lab control. A single process fluctuation takes 2 hours, depending on a change in some control set point (average value) from data of the previous analysis. Here, the set point is specified at 80%. In a fertilizer process, one set point could be the % of product within 2.5 and 3.5 mm, that is, the narrower the distribution the better. On the other hand, one set point might also be the % of product with a “roundness” factor greater than 0.88 (1.0 being a perfect sphere), or a Convexity value (surface roughness (1.0 being perfectly smooth) greater than 0.92.
Sampling and measurement are nearly constantly automated with on-line control. This means that the on-line process variables, which may have to be altered to bring it back under control, (moving back toward set point), are adjusted more frequently than in lab control, and the set point can be raised to obtain more product within specification, which in this case is 90 versus 80%, thus enhancing the fertilizer’s performance in the field. The turnaround time for transmitting new on-line control signals automatically back to the process in fertilizer production is in fact in the order of around five minutes.
- On-line sampling frequency of PartAn identifies the fluctuations
- Lab sampling frequency of every two hours does not detect the fluctuations
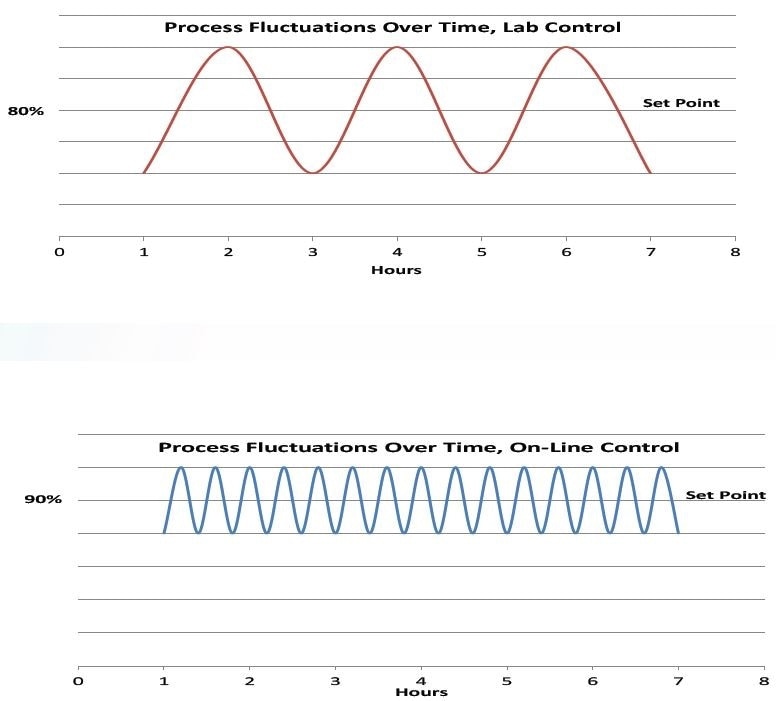
Figure 3. Graphs of process fluctuations illustrating the advantages of on-line control over lab control.
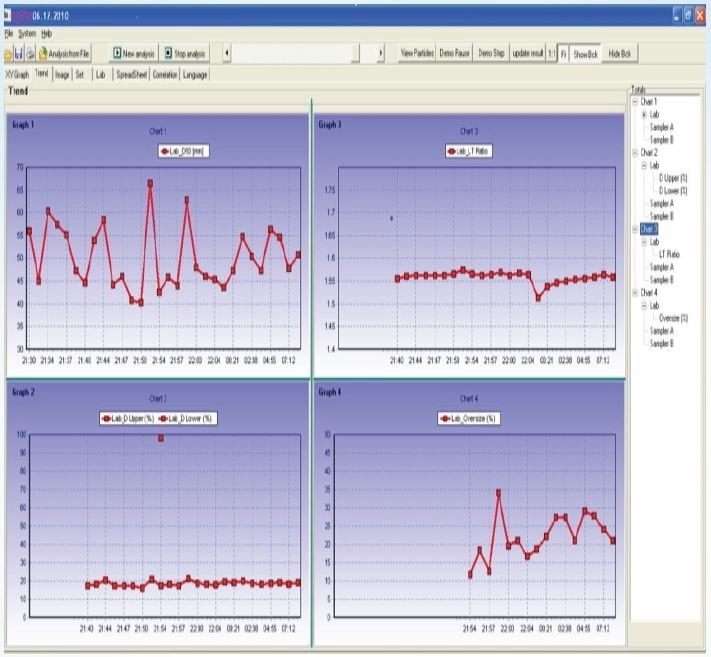
Figure 4. An example of the PartAn Trend (fluctuations over time) presentation. Parameters for presentation are user-selectable in the PartAn software. These parameter results can be used by the operator to make the proper process adjustments when necessary to bring the process under tighter control, or they can be acted on automatically by a computer equipped with PID and Programmable Logic control algorithms for adjusting the process variables in a feedback loop.
Large fluctuations can be controlled by process equipment. Improved production can be a result of less fluctuation because the Melt feed rate is an modifiable process variable; the higher it can be operated, due to quicker control response and lower fluctuations, the higher the production rate will become. (1)
The use of PartAn can decrease the unanticipated down-time in the process (longer up-time), as on-line control will bring the process from start-up to steady state operation much faster than that of lab control. (2)
According to the increased revenue gained from these production increases, the payback period for the equipment investment can be calculated (3).
Research and Development
The PartAn can also be used as a lab instrument for R&D purposes. With the development of new and improved fertilizers from new compounds and/or processes, the ability to produce the same amount of information regarding the product makes sense as it can later be controlled on-line. During the development period, the different morphological parameters measured would be reported in the history of how the product performed, in relation to these parameters. This information can then be directed to take control steps as on-line analysis would indicate in the process.
The Technology
Image Analysis is one of the latest technologies being used for particle characterization. This method is logical, simple, and easy; providing around 24 more morphological (sizes and shapes) parameters compared to traditional particle size analyzers. It consists of a combination of optics, a strobe light, and a digital camera, which records images of moving particles. If the pixel size is known, and based on the relative locations and the number of the pixels, all the parameters can be easily measured. Some of the size parameters measured are the several equivalent diameters, lengths and widths, as well as minimum and maximum distances.
Aspect ratio, and a number of surface roughness and roundness factors are some of the shape parameters. Some of the data forms available for each parameter are summary data and both number and volume distributions. A file of images of all particles measured is illustrated below, and both the 3D and 2D parameters are listed at the upper right side of any particle chosen. Compared to other image analyzers, only the PartAn can calculate the complete 3D results based on a patented particle tracking method.
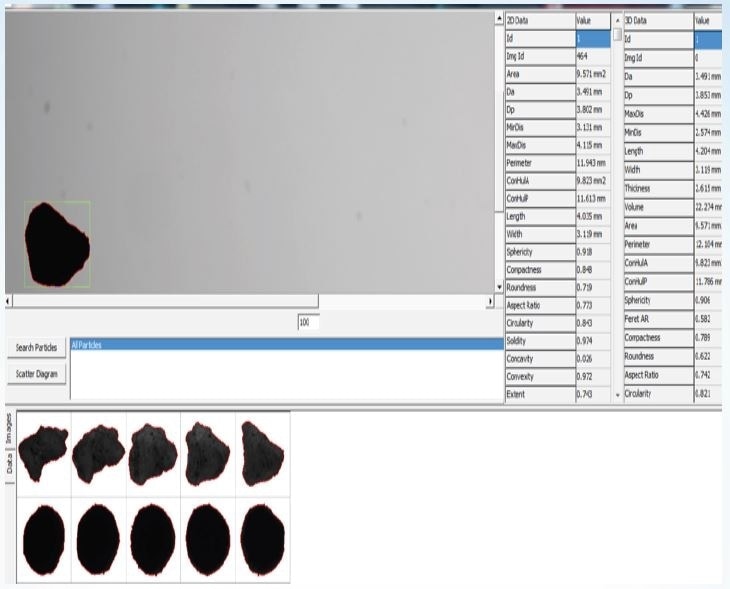
Figure 5. Particle images. Each row contains different orientations of one particle, which allows the 3D calculations.
A Scatter Diagram (illustrated below in blue) offers a view of where each particle is located, relative to the two distribution parameters in the red graphs. In this instance, diameter (size) in the top graph and roundness (shape) - the two most vital features for fertilizer - are plotted to the right of the Scatter Diagram.
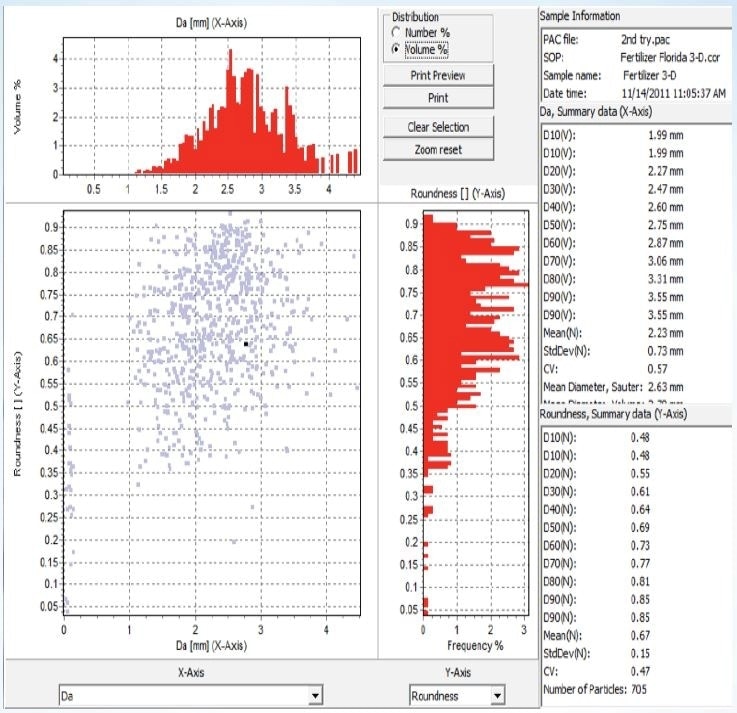
Figure 6. Scatter Diagram giving the relative location of each particle for size and roundness, and distributions of those parameters along with their Summary data. Any two of the 24 parameters can be plotted here.
Characteristic distribution graphs and tabular data can be exhibited in up to six overlays of different parameters for one analysis, or the same parameter for six different historical samples, as shown below.

Figure 7. Overlays of six different parameters and as differential and cumulative distributions for one sample.
Conclusion
Good quality of fertilizer can be confirmed through key parameters such as size and shape. Round, smooth particles and narrow size distributions are essential for even leaching rate of the nutrients to crops. These two parameters can be easily measured by image analyzers.
Since 1988, on-line image analyzers have been employed in fertilizer plants globally to provide strict and fast automatic control of these parameters. For new and improved fertilizers, lab image analyzers can provide the historical size and shape data through the development process. This data can be used to plan the production control arrangements for innovative products. Due to the short payback time for on-line installation, unexpected downtime can be easily minimized. The only image analyzer that offers comprehensive 3D size and shape information is the PartAn.
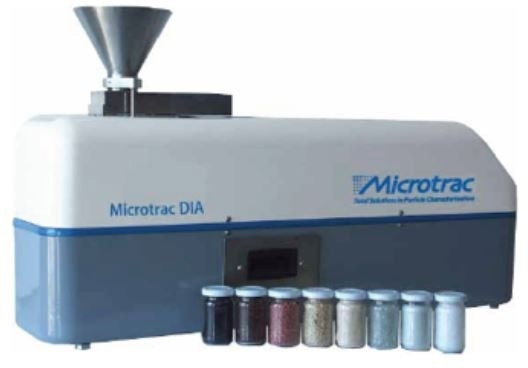
Figure 8. The PartAn, laboratory version.
Footnotes
1. Benefit: Increased production - If production can be increased by 1% for a 50-ton/hour production facility, and up-time in the process is 90%, then the increase in production is 0.5ton/hour * 24 * 365 * 0.9 = 3942 tons/year, or $1,971,000/year.
2. Benefit: Increased production time (up-time) - Assuming a conservative increase of 1% that will result in about 90 hours longer production time per year. At 50-ton/hour that will give 50 ton/hour * 90 hours * $500/ton = $2,250,000/year. Combined, these two benefits of on-line analysis represent about a 2% increase in production and revenue.
3. Payback time for PartAn on-line installation: Based on the 2% incremental revenue, if the price of the PartAn on-line installation with sampler is $ 150,000 and the price of 1 ton of fertilizer is $500, then the payback period will be about 14 days (3)

This information has been sourced, reviewed and adapted from materials provided by Microtrac MRB.
For more information on this source, please visit Microtrac MRB.