Austenitic welds and welds that contain heterogenous weld materials are increasingly used in various industries. These welds can be used to manufacture components with enhanced or custom-engineered properties. For instance, a part may require good corrosion resistance in one area and high temperature resistance in another area. Other structures may require high strength in one area and a combination of wear resistance or toughness in another area.
Using ultrasonic phased array technology for the inspection of these types of welds poses difficulties in relation to the variations in acoustic properties and density of the materials (anisotropy). This article offers a simple step-by-step summary of the points to consider while performing ultrasonic (UT) inspections of dissimilar or austenitic material welds. It also demonstrates the use of Evident’ comprehensive range of flaw detection products—such as the FOCUS PX™, the OmniScan® instruments and phased array probes and wedges—to enable the inspection process.
Introduction
In industrial sectors, such as the power generation and oil and gas industries, pipelines in which a carbon steel pipe is clad with a corrosion-resistant alloy (CRA) are used very often; the same alloy can even be used as a filler material for girth welds (Figure 1). These interfaces, and several other types of dissimilar-material welds, can hinder non-destructive testing (NDT) and are conventionally tested with the help of radiography.
However, radiography involves long exposure times and potentially hazardous radiation. These challenges along wirh advancements in phased array technology, have rendered ultrasound an outstanding substitute for these types of inspection.
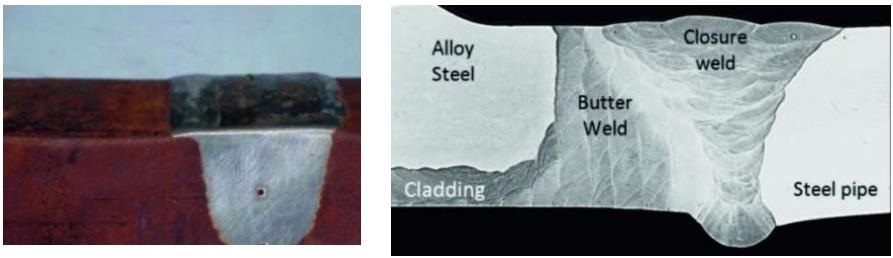
Figure 1. Welding clad pipes that containg a dissimilar weld material (left) and a weld used to join two different materials (right).
The Challenges of UT Inspection
Traditional UT is an advantageous and established method for the inspection of carbon steel welds. However, during the inspection of dissimilar weld material, various aspects render UT inspection highly complicated.
Metal-Metal Interface and Grain Size
When a UT beam passes through a component that consists of a weld, the UT waves can be reflected (backscattered) and refracted by the metal-metal interface as well as the coarse-grained structure of the weld. As a result, the beam is skewed and attenuated (Figure 2).
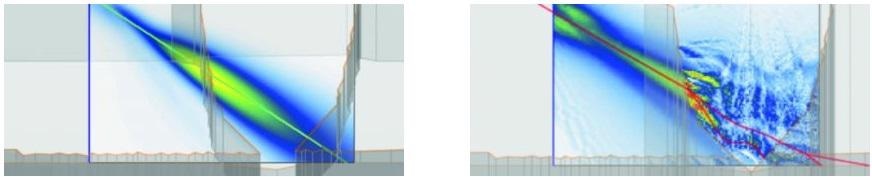
Figure 2. Distribution of energy in welds in a weld containing a similar weld material (left) versus a dissimilar weld material (right). At the interface, skewing and attenuation of the UT beam occur when using shear waves.
Figure 3 illustrates an example of the impact of the highly reflective interface between the Inconel of the weld and the carbon steel of the parent material on the propagation of the UT scan. This results in a scenario where it is impossible to detect the side-drilled holes formed to test the inspection sensitivity with the help of traditional shear waves, suggesting that it is necessary to use a different propagation wave.
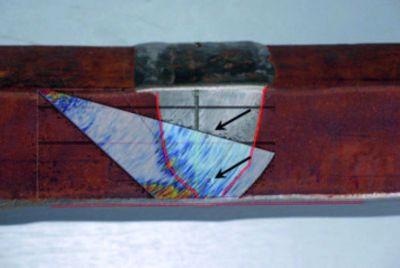
Figure 3. Shear wave UT scan. Scan at 5 MHz shown on top of an image of the component. The side-drilled holes (black arrows) were not detected.
Attenuation
Each material included in a dissimilar-material weld has a unique attenuation factor and can be attenuative and inhomogeneous. This indicated that at different depths and different angles, the attenuation will differ along the sound path. A perfect sensitivity calibration would provide the same response for similar indications positioned at different positions and at different depths in the weld volume.
At the interface, attenuation and skewing of the UT beam take place when shear waves are used. When using dissimilar weld materials, it is very difficult to compensate for the variable attenuation, and it is impossible to achieve perfect, consistent sensitivity throughout the weld and its heat-affected zone. As a result, it is necessary to assess the sizing in relation to a sensitivity level.
The inspection of these types of welds can be optimized by taking into account the same variables as traditional carbon steel welds. However, the following steps (A–D) have to be thoroughly assessed to obtain sufficient detection of indications. Below are the most crucial steps:
(A) Scan planning
- Propagation mode—longitudinal versus shear waves
- Transmit-receive longitudinal (TRL) technique
- Ensuring full coverage of the weld
- Electronic focusing and probe selection
- Instrument capabilities
(B) Calibration
- Selection of the calibration block
- Calibration of wedge delay
- Calibration of sensitivity
- Adjustment of detection level
(C) Sizing and depth tolerance of indications
(D) Coupling
Each of these parameters will be discussed in the following sections—common problems will be explained, and suggestions on ways to realize accurate and rapid results during the inspection of the challenging welds will be offered.
(A) Scan Planning
Propagation Mode—Longitudinal Versus Shear Waves
One of the main factors to be considered during the inspection of challenging welds is the selection of the wave type for the inspection. When a weld is scanned, compared to shear waves, longitudinal waves exhibit better transmission of the energy of the UT beam. When the impact of the propagation mode on the UT beam (Figure 4) is modeled, it can be observed that the beam undergoes a higher degree of skewing upon using shear waves. Hence, in spite of the potential interference from reflected shear waves, it is recommended that longitudinal waves should be used for inspecting dissimilar weld materials.
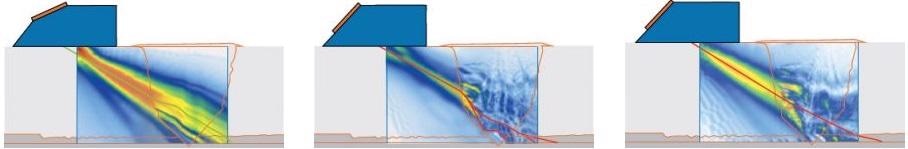
Figure 4. A computer model of different wave types—2.25 MHz longitudinal waves (top), 1 MHz shear waves (bottom left), and 2.25 MHz shear waves (bottom right) in a pulse-echo configuration showing that the material has a greater negative effect on the quality of the beam when using shear waves (as shown by the irregular shape of the red line).
Reducing Noise with the Transmit-Receive Longitudinal (TRL) Technique
The next factor to be decided to develop the optimal inspection framework is whether to use one or two transducers. Inspection of welds can be performed with the help of either two separate transducers for transmitting and receiving, or with a single transducer. Since higher noise levels are produced in these challenging components, using only one transducer (also called the pulse-echo technique) is not ideal, and the TRL technique (which involves using two transducers) is recommended.
The TRL technique, or the pitch-catch technique, involves the use of different transmitter and receiver transducers to ensure that the collected signals only originate from the area at which the two beams cross each other. In addition, the use of a separated pulser and receiver reduces the wedge size—as the need for using dampening material is eliminated, the probe can reach closer to the weld, ensuring higher sensitivity.
When longitudinal waves are used for performing this two-transducer approach, low interference is combined with better penetration, as against the use of shear waves. This combination ensures that a signal with a lower noise level is received (Figure 5).
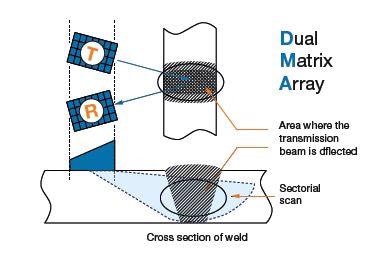
Figure 5. The TRL technique. This technique uses separate transmitting and receiving probes to reduce noise.
Traditional UT transducers and also phased-array probes can be used for performing the TRL technique. The advantage of using phased array is that it is possible to use sectorial scans, providing imaging capabilities and enabling easy coverage without the need for moving the probe backward and forward.
These capabilities, in conjunction with optimal control over the UT beam, simplify the inspection to ensure enhanced detection capabilities, although, in certain cases, multiple distances might be needed between the probe and the weld’s center line to ensure the best orientation of the beam against the indications to be detected.
Evident’ flaw detection solutions—for example, the FOCUS PX and OmniScan MX2 instruments—offer higher versatility in the scanning process, and allow the TRL technique to be used in conjunction with phased array technology. A dual matrix array (DMA) probe including two probes in which each array is formed of multiple rows and columns of active elements (Figure 6) can be used to carry out this type of inspection.
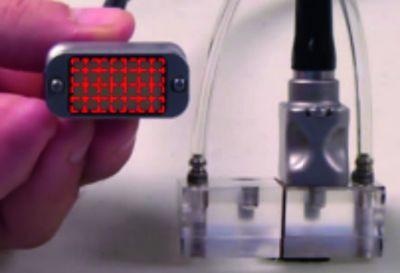
Figure 6. A wedge holding a DMA probe. The probe consists of two transducers containing 28 phased array elements each.
DMA probes come in different sizes, frequencies, and number of elements, appropriate for a wide range of inspections. The row-and-column arrangement of the elements allows phased array technology with DMA probes to offer various crucial functionalities:
- Sectorial scans (Figure 5)
- Skewing of the UT beam (Figure 7)
- Correction of the curvature during curved-surface inspections (Figure 8)
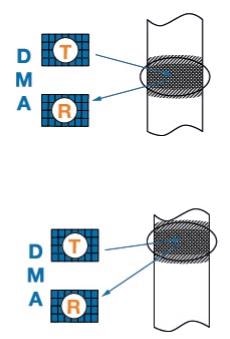
Figure 7. The TRL technique and DMA probes. Using the TRL technique with DMA probes offers the ability to steer the skew angle of the beam.
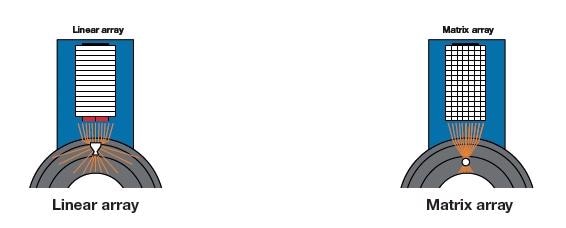
Figure 8. DMA probes and curvature. A DMA probe (right) better compensates for the curvature of the surface of a component—a smaller focus point provides better sensitivity.
When the TRL technique is used, the volume in which a signal with adequate energy can be acquired is reduced. Figure 9 illustrates the region of the ensuing energy of the TRL technique at the crossing point. In comparison to the pulse-echo technique, the energy is considerably lower before the point where the beams cross, and further away from the crossing area.
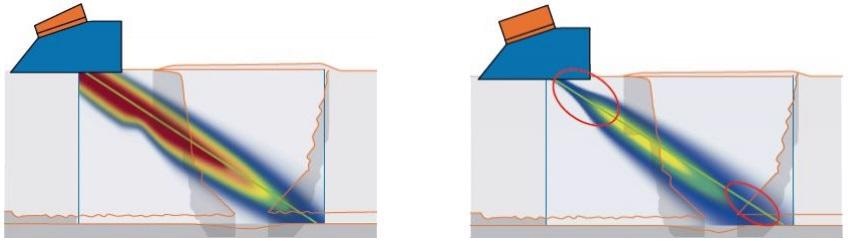
Figure 9. Pulse echo versus the TRL technique. Model of the energy of a pulse-echo transducer (left) compared to the TRL technique (right) and the resulting energy of the transmitter and the receiver beam.
Figure 9 also illustrates the reduced depth of field when the TRL framework is used. In the region immediately below and in between the two transducers—in the region before the beams cross—no or low energy exists, which indicates that sensitivity is poor.
Further away from this crossing area, the energy is also reduced as it originates from the far field of each transducer. The beam spread of each transducer leads to a rapid decrease in sensitivity at these depths. Yet, the area covered by the scan is still adequately large.
To conclude, when compared to a pulse-echo technique, TRL ensures a reduction in noise level. A pseudo-focused beam in the setup ensures that the energy originates only from the area of interest, at which the two beams cross each other. Moreover, the low profile of the wedge also enables a short approach to the weld, which is advantageous for sensitivity.
Inspecting the Surface and Ensuring Full Coverage of the Weld
Obtaining full coverage of the weld is crucial when the TRL technique is used. Figure 9 shows that there are limitations in the potential of the TRL technique to realize a comprehensive weld inspection with the help of longitudinal waves. However, it is vital to ensure that the full weld volume is covered.
A disadvantage of using longitudinal waves is that shear waves are generated simultaneously (Figure 10). This suggests that the difference in velocities when the longitudinal waves bounce off the bottom surface of the component results in the interference of the shear waves with the detection of the longitudinal waves reaching the weld and principally its top area.
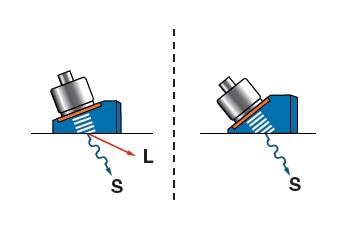
Figure 10. Longitudinal and shear waves. Generating longitudinal waves means that shear waves are also created.
The potential of longitudinal waves to bounce off the bottom surface is also limited by the internal cladding of a material that is different from the main component (Figure 11).
Figure 11. Internal cladding affects wave bounce back. The bottom surface of a component cannot be used for bouncing back longitudinal waves when this surface is coated with a CRA.
To overcome the challenges in the inspection of the uppermost section of a weld using a longitudinal-wave sectorial scan, the near-surface volume of the weld can be covered with the help of surface waves (Figure 12).
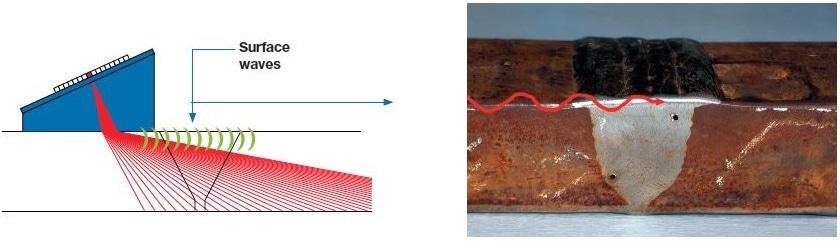
Figure 12. Wave propagation paths. Left, longitudinal waves (red) and surface waves (green). Right, surface wave propagation across the surface of the weld cap (red).
Based on the material, the probe parameters, and the structure of the weld, surface waves facilitate inspection of the first few millimeters in front of the probe. If this distance is considered to be sufficient, it would be possible to perform the inspection without removing the weld cap.
If required, it is advisable to flush away the weld cap and perform a second scan on top of the weld itself to guarantee full coverage up to the center line.
Electronic Focusing and Probe Selection
A final aspect to be taken into account during the selection of the appropriate phased array probe for a specific type of inspection is the probe aperture, and also the need to change the spot size through electronic focusing.
In cases where good sizing capability and good sensitivity are mandatory, ultrasonic phased array technology provided significant advantages, such as the control of the spot size of the UT beam. Based on the material thickness, maximum sensitivity can be achieved at the depth of interest by increasing or decreasing the spot size.
Every phased array probe has a natural focusing depth (also called the near-field distance, N0). Mechanical focusing (as illustrated in Figure 13, right) and/or electronic focusing (Figure 13, left) can be adopted to reduce the spot size and concentrate the energy at the depth of interest, thereby moving the focal point closer to the surface compared to N0.
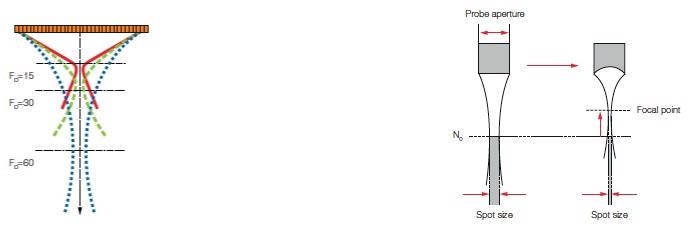
Figure 13. Phased array probe focusing. Electronic (left) and mechanical (right) focusing of a phased array probe decreases the spot size and moves the focal plane closer to the probe.
However, for the inspection of a thicker component, the focal plane cannot be lowered by electronic focusing. In such instances, a phased array probe with a higher probe aperture has to be used. The probe aperture size can be increased in two ways, which can be used individually or in conjunction; the two techniques are as follows:
- Increasing the number of elements used to perform the scan: This enables an inspector to reach greater depths without affecting the beam-steering ability and accuracy. It is necessary for the electronic equipment employed to drive the elements to have adequate capability to handle the higher number of elements—an active aperture comprising of 16 elements might not be adequate.
- Increasing the size of the individual elements: This process eliminates the need for more powerful equipment to drive the elements; however, probes that have larger elements have limited potential to steer the beam. Optimal beam-steering capability is mandatory for carrying out a good sectorial scan and cover the weld volume in the best possible manner.
Instrument Capabilities
For inspecting a weld from both sides, the phased array instrument should be in a position to drive multiple probes at the same time to ensure a single-pass inspection. In such instances, a 128-channel phased array instrument is usually needed.
In order to overcome these difficulties, Evident has created an array of phased array instruments and probes that enable the inspection of complex welds and ensure durability and safety. A typical DMA probe (frequency 4 MHz) can be employed for the inspection of components that have a thickness of up to 25 mm.
For more in-depth inspections, or while inspecting welds with a larger grain size, it can be difficult to achieve adequate wave propagation. In such instances, it is advisable to use a probe with a larger active aperture and a lower frequency (1.5 or 2.25 MHz). The FOCUS PX acquisition unit and the OmniScan 32:128PR flaw detector (Figure 14) can be used for driving all types of probes.
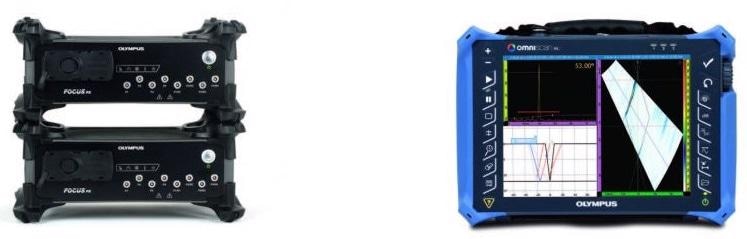
Figure 14. Evident’ FOCUS PX and OmniScan MX2 instruments can drive DMA probes
(B) Calibration
Selection of the Calibration Block
After selecting the right combination of phased array equipment, it is mandatory to select an appropriate calibration process. Since calibration is a crucial element of UT inspections, the first significant consideration is to select an appropriate calibration block (Figure 15).
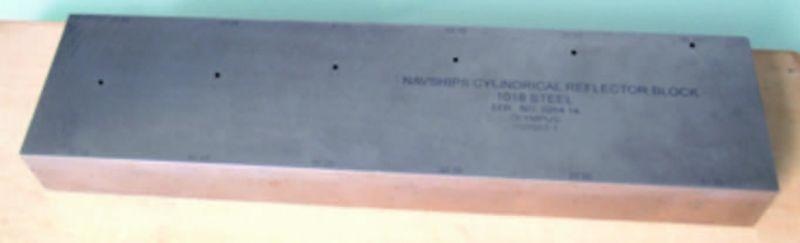
Figure 15. A calibration block for UT inspections
While selecting a reference block, two main parameters must be considered; the repeatability of the inspection and the sensitivity of the calibration:
- Repeatability relates to the production of the same report while employing two inspectors using the same inspection procedure. It also relates to the possibility of consistently duplicating the selected calibration block for different operators.
- Sensitivity relates to the setting of a reference level in accordance with an established indication (which is often a side-drilled hole) that exists in the calibration block, which is comparable to a real indication.
For a calibration block, the two main options are:
- A reference block made of a production weld, analogous to the one to be inspected.
- A reference block made of only the parent material, which has no welds.
Despite the fact that a reference block including a real weld is more representative of an actual inspection, it has various significant disadvantages, mainly in relation to repeatability:
- The detection sensitivity of indications could differ when drilled at somewhat different depths
- It is possible for the inhomogeneous weld material to attenuate UT energy and produce different levels of scattering at different positions in the weld
- Different beams produced at different angles could have different velocities
- Waves produced at different angles do not have the ability to travel through the same amount of weld material
- In case the use of two equal calibration blocks is necessitated, the attenuation might vary from one block to another because of difference in the manufacturing process
Chances are that these problems result in lack of repeatability, which indicates that it would not be possible to ensure the sensitivity level. If a reference block is made of only the parent material, two blocks with precisely the same properties, such as velocity and attenuation, can be easily created. This also guarantees that the sound paths are the same and hence have a similar attenuation.
Wedge Delay Calibration
When angled beams are produced by using a wedge, it is necessary to calibrate the entire setup. The wedge delay calibration can be maintained similar to a standard pulse-echo inspection; it is possible to use a reference block that contains well-defined reflectors.
Sensitivity Calibration
In the majority of instances, two sensitivity calibrations are performed: one for the surface waves that cover the upper (near-surface) part of the weld and one for the longitudinal waves that cover the main volume. Upon ensuring the repeatability of the calibration by selecting an appropriate calibration block, it would be possible to carry out sensitivity calibration. This can be performed by applying a fixed gain or a time-corrected gain (TCG), which involves scanning the side-drilled holes at varying depths.
In the case of carbon steel welds, TCG calibration can be straightforward to perform. It facilitates a sensitivity calibration, for instance, by scanning the side-drilled holes (Figure 16). In the case of attenuative and inhomogeneous materials, it can be challenging to perform the TCG by employing a technique different from the pulse-echo technique. It is possible to reach the different side-drilled holes with different sound paths, with different attenuations, which leads to differences that are too large for the gain necessary for each reflector.
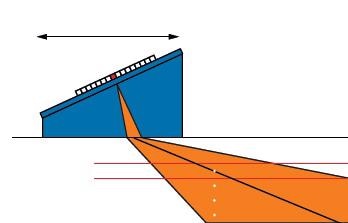
Figure 16. TCG calibration. The phased array probe is moved across a calibration block with side-drilled holes to equalize the amplitude of all UT beams (A-scans) of a sectorial scan.
In case TCG is not used, a reflector—positioned on the weld bevel, for instance—can be used as a reference. Yet, if TCG is necessary and the depth of field (length of area at which energy is adequately high—see Figure 17) is reduced due to the use of the TRL technique, it could be challenging to carry out the TCG. This is due to the fact that the gain necessary to fully compensate the entire UT beam might be very high.
Care should be taken to always limit the number of TCG points to the useful area of each UT beam and the angles of the sectorial scan. Very deep TCG points for high angles need not be taken into account since the beam will never cover such deeper areas of the weld.
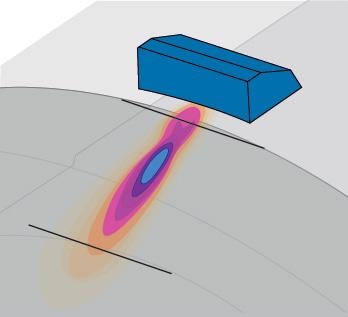
Figure 17. The limited area where TCG can be applied
The setup is simpler for the surface wave calibration; a notch in the outer diameter (OD-notch) is used and is fixed to 80% amplitude with different distances between the probe and the notch.
Detection Level
After performing the sensitivity calibrations (with or without a TCG), it is still necessary to adjust the gain level of the surface and longitudinal waves to offer a reference value. This is usually carried out by measuring typical established indications, for example, a real indication or a flat-bottomed hole in a real weld (Figure 18).
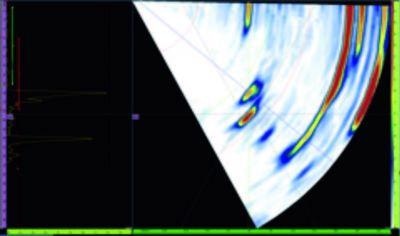
Figure 18. Detection level adjustment on a well-known indication
It is necessary for the gain to be adjusted to guarantee that the noise level is maintained to a minimum so that the different imaging modes—such as B-scan, S-scan, and C-scan views—offer the easiest possible detection (Figure 19). It is crucial to perform scans with the best possible signal-to-noise ratio since this will ensure clearer images and ease the analysis process.
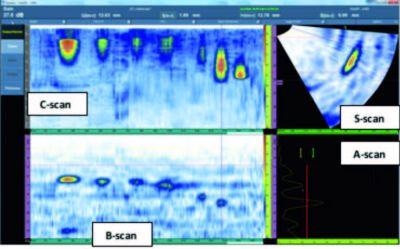
Figure 19. The gain level should be adjusted to ensure clear images
(C) Sizing and Depth Tolerance of Indications
Selection of the Calibration Block
Upon selecting the right combination of phased array equipment, it is necessary to choose an appropriate calibration process. Since calibration is a vital part of UT inspections, the first significant aspect to be taken into account is the selection of an appropriate calibration block (Figure 15).
Moreover, it is crucial to determine the depth tolerance (maximum depth measurement that can be carried out as against the real depth), specifically when two different materials with different properties exist in the path of a UT beam. In such cases, the energy is scattered and could be deviated, and hence, the beam angle value cannot be fully ensured (Figure 20). As a result, the depth measurements could be influenced, making it necessary for the depth tolerance to be adjusted. For an operator, it would usually be safer to oversize indications and not undersize them. However, oversizing could result in needlessly high rejection rate, which suggests that investing in better sizing validation results in fewer rejections. An optimal technique for sizing validation is to scan multiple samples with artificial reflectors that represent real indications to be detected, which can subsequently be macro-sectioned for size confirmation.
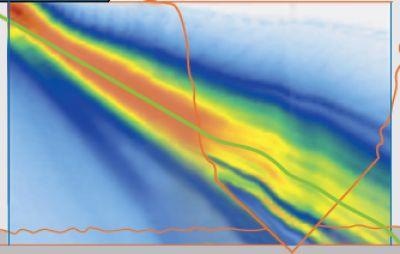
Figure 20. UT beam deviation computer simulation showing how a material can cause deviation of the UT beam
(D) Coupling
A final aspect to be taken into account while determining an inspection protocol is the challenge of coupling. When the TRL technique is used, two probes that produce two UT beams are held by the wedge. This suggests that there are two distinctive exit points at distinctive areas on the wedge (Figure 21). As a result, the inspection could be influenced by coupling challenges. Care must be taken to eliminate air bubbles between the component and the two probes. This can be achieved with the help of a manual or an electric water pump.
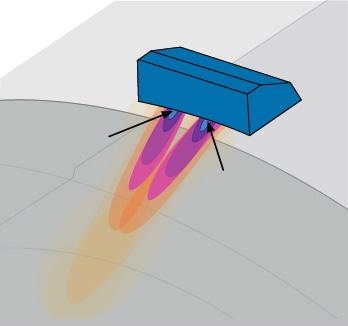
Figure 21. The TRL technique and coupling. With the TRL technique, there are two exit points (black arrows) that need good coupling as opposed to one single point for the pulse-echo technique.
Conclusion
Ultrasound technology can be employed for detailed and rapid inspection of even the most difficult welds. Yet, many considerations related to the equipment, methods, and calibration have to be taken into account to guarantee a favorable inspection procedure. As is the case for any inspection technique, it is vital to gain insights into the limitations of the technique and to fine-tune the procedure accordingly. This article has offered a summary of the difficulties and the considerations related to a structure that is specifically challenging to inspect—the dissimilar-material weld.
In the recent past, inspection professionals from various industries have shown the evident advantages of using Evident’ integrated, off-the-shelf phased array instrumentation (FOCUS PX, OmniScan MX2), phased array probes, and software. Upon adequately addressing the potential issues, described in this article, the TRL technique in combination with the DMA probes can ensure a precise and assured inspection process.
In instances where coarse-grained materials are used—for instance, liquefied natural gas (LNG) tanks with cladded components or 9% nickel welds such as vessels or pipes used in the power generation industry—UT inspection is a remarkable substitute to radiography, which usually requires long exposure times and high-energy radiation, poses security issues, and produces waste. UT inspection has the ability to increase productivity and eliminate harmful radiation, while also preserving a considerably high detection level and exceptional sizing capability.
This information has been sourced, reviewed and adapted from materials provided by Evident Corporation.
For more information on this source, please visit Evident Corporation.