Image analysis as a technique for the quantification of particle size and shape information has existed for many years. Prior to the advent of digital image analysis simple measures such as Feret’s and Martin’s calliper diameters were used to classify particle size, and simple ratios of such measures could be used to describe particle shape.
Calliper Measurement Problems
However, as can be seen from Figure 1 these simple calliper measures showed variance dependent upon the orientation of the particle in the 2-dimensional field of view.
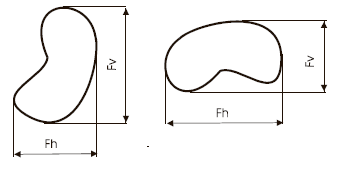
Figure 1. Example of the variance possible with simple calliper measures such as Feret's horizontal (Fh) and Feret's vertical (Fv) diameters.
Digital Image Analysis
With the advent of digital image analysis these calliper measures have increased in robustness as principal axis transformation has allowed the maximum and minimum Feret’s diameters to be easily found, and shape descriptors based on a central moment have been developed, so removing the 2- dimensional orientation dependence.
This has led to the situation where we now have a suite of robust 2- dimensional particle shape and size factors available to aid us in assigning morphological description to a particulate system.
Dynamic Image Analysis
Increases in computer processing power has led to the emergence in recent years of both static and dynamic image analysis instruments that are capable of rapidly classifying 10’s, if not 100’s of thousands of particles. This has moved image analysis, for the determination of particle morphology, away from a qualitative technique where perhaps just a few 100 particles were analysed, to a quantitative technique with statistically valid data being produced.
Examples of two such instruments are Malvern Panalytical’s PharmaVision 830 (Static) and Sysmex’s FPIA-2100 (Dynamic).
Particle Orientation
Figure 2 illustrates the principal that particles falling onto a surface will adopt their most mechanically stable state. This means they will present their largest area to the observer and as a consequence their longest and second longest dimensions (useful when comparing results to other techniques, such as sieving where the second longest dimension will be applicable).
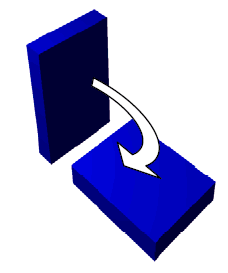
Figure 2. Particles will adopt their most mechanically stable state.
Simplification Of Shape Assessment
This is advantageous as it greatly simplifies the assessment of shape and the majority of shape factors commonly in use today have been developed by assessing particles as 2-dimensional projections presented in this condition.
With the advent of dynamic image analyzers particles may well have the ability to adopt any orientation within 3-dimensions.
Rod Shaped Particles
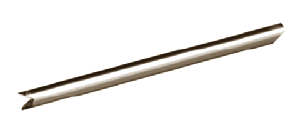
Figure 3. Rod shaped particle.
If we consider the rod shaped particle shown in figure 3. This type of particle has 2 similar dimensions (breadth and thickness) and one dissimilar dimension (length).
Therefore, it can present a number of 2-dimensional shapes and sizes to the detector dependent upon how the particle is orientated in 3-dimensions; some of the possibilities are shown in figure 4.
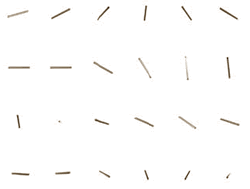
Figure 4. Rod-like particle shown in various orientations in 3- dimensional space.
Importance Of Orientation Control For Rod Shaped Particles
Presented to image analysis software this one particle without control of its orientation produces the size and shape distributions shown in Figure 5.
As can be seen from the distributions shown in Figure 5, variance in particle orientation leads to a complex shape and size distribution for this simplest of particle systems, composed as it is of a purely monodisperse distribution. The situation will be even more complex for a polydisperse distribution of such particles.
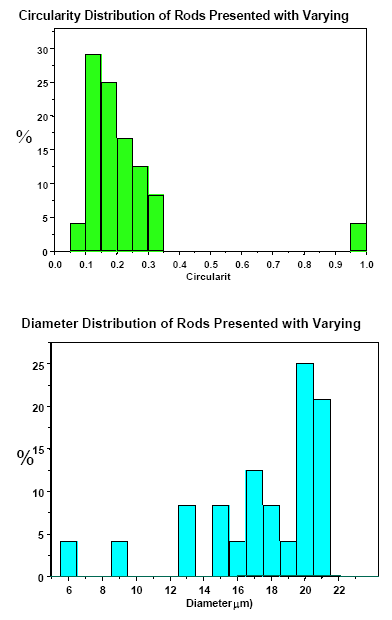
Figure 5. Circularity (top) and Diameter (equivalent circular area) distribution graphs for rod-like particles with varying orientation as shown in Figure 4. The actual distribution should be a single peak – at the largest size and at the lowest circularity of these distributions.
The particles are capable of generating an infinite number of size and shape values dependent upon the orientation of the particle. This effect will be exacerbated if the system utilizes re-circulation or does not ensure all particles are in focus.
Controlling Orientation
It is evident therefore that to produce valid, meaningful data for asymmetric particles, orientation needs to be tightly controlled.
PharmaVision 830
The PharmaVision 830 controls particle orientation as powders are either dispersed dry onto a glass slide or dispersed in oil on a glass slide; either way particle orientation is assured as particles will adopt their most mechanically stable orientation. This also has the added benefit of ensuring that particles are kept within a relatively constant plane of focus eliminating the need for out-of-focus rejection algorithms.
Sysmex FPIA-2100
The Sysmex FPIA-2100 is a dynamic image analysis system that also ensures particles are favourably orientated and kept within a narrow plane of focus. The FPIA-2100 achieves this by employing a patented hydrodynamic focusing system; this is illustrated in Figure 6.
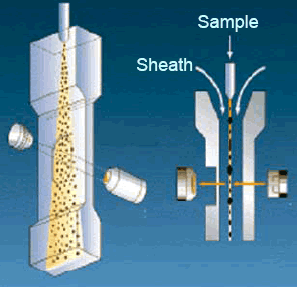
Figure 6. Illustration of the hydrodynamic focusing system employed by the FPIA-2100.
Hydrodynamic Focusing
In hydrodynamic focusing the sample flow is injected between two sheath flows; this causes the sample flow to narrow and become planar. The sample flow is therefore retained at the plane of focus of the instrument and particles within the flow will naturally align themselves with their greatest area toward the detector, so ensuring a consistent particle orientation.
Particle Orientation During Measurement
Examples of particles captured during measurement on the FPIA- 2100, Figure 7, amply illustrate that particle orientation is occurring during measurement.
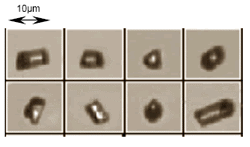
Figure 7. Example of glass rod particles measured on the FPIA- 2100. Note consistent alignment even of the smallest and lowest aspect ratio particles.
This ability to present a consistent particle orientation to the detector simplifies greatly image analysis and allows trends in particle shape and size to be readily identified and makes comparisons between samples relevant.
To illustrate this fact, Figure 8 shows the results from the analysis of rodlike particles on the PharmaVision 830. The trend between increasing particle size and decreasing circularity is clearly visible and unambiguous.
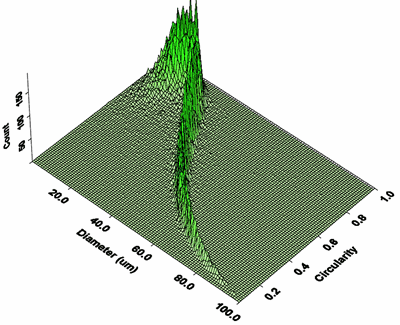
Figure 8. 3-D plot of particle diameter against circularity for a rod-like material. The trend indicates that as diameter increases circularity correspondingly decreases, indicating that particle width is fixed whilst length increases.
Without consistent particle orientation the trend observed in Figure 8 would have, at best, been less distinct if not totally lost within statistical noise.
Conclusion
The majority of shape descriptors available to today’s analyst have been developed from the 2- dimensional study of 3-dimensional particles/features presented in a mechanically stable orientation.
Variance in particle orientation will lead to a diminution of data quality and reproducibility. The major advantage of image analysis technology over traditional ensemble characterization techniques is the sensitivity to differences in shape and size characteristics. Some method of consistent particle orientation is required in order to prevent statistical noise reducing this sensitivity.

This information has been sourced, reviewed and adapted from materials provided by Malvern Panalytical.
For more information on this source, please visit Malvern Panalytical.