Nickel is created from two very distinct ores, sulfidic and lateritic. Sulfidic ore is normally found alongside copper ore and is mined underground, while lateritic ore is mostly located in tropical countries like Indonesia and mined from a range of depths underneath the surface.
The production of nickel has seen a rise in demand in recent times because nickel is the main element of lithium-ion batteries employed in electric vehicles. As such, a precise, efficient and accurate technique is required for the measurement of these ores in both the refining and mining processes.
X-Ray fluorescence spectrometry (XRF) is a well-reputed analytical technique to establish chemical composition in materials with minimal sample preparation and high accuracy. This makes it a popular quality and process control method in several industries.
Instrumentation
The Thermo Scientific™ ARL™ QUANT’X EDXRF Spectrometer features a Silicon Drift Detector (SDD) and a 50 watt Rh or Ag target X-Ray tube, which is air cooled with a 50 kV maximum excitation voltage.
A set of nine primary beam filters is engineered to enhance the peak-to-background signals for all elements from F to Am. Autonomous analysis of multiple samples is made possible by the 10-position auto-sampler with spinner.
Its SDD continues to be the benchmark of performance for all energy-dispersive detectors. The substantial active area of 30 mm² allows characteristic element X-Rays released by the sample to be successfully captured.
Excitation Conditions
In EDXRF, precision and sensitivity are attained through the targeted excitation of the sample to fluoresce only the elements of interest. The ARL QUANT’X EDXRF Spectrometer provides several primary beam filters for ideal background control and a nearly endless combination of excitation voltages (4-50 kV).
For a total live time of 5 minutes, spectra were acquired on each nickel ore sample, as demonstrated in Table 1. Based on the specific application, the measurement time can be further adjusted. The analysis is performed in air.
Table 1. Analytical conditions. Source: Thermo Fisher Scientific – Materials & Structural Analysis
| Condition |
Voltage |
Tube Filter |
Medium |
Live Time (s) |
Elements |
| Low Za |
4 |
No Filter |
Air |
180 |
Mg, Al, Si |
| Low Zb |
8 |
C Thick |
Air |
60 |
S, Ca, K |
| Mid Za |
16 |
Ag Thin |
Air |
60 |
Ti, Cr, Mn, Fe, Co, Ni, Cu, Zn |
Sample Preparation
Calibration was performed utilizing 17 nickel ore Certified Reference Materials (CRM) from OREAS®. Samples were pressed into pellets without binder at 20 tons.
Table 2 presents the concentration ranges of the various oxides measured by the calibration along with the RMSE (root mean square error) and R² values acquired for the various compounds.
Table 2. Concentration ranges and calibration parameter values for the analysis of nickel ore. Source: Thermo Fisher Scientific – Materials & Structural Analysis
| Element |
Min % |
Max % |
R2 |
RMSE |
| MgO |
0.7 |
27.3 |
0.9986 |
0.4 |
| Al2O3 |
1.6 |
17.5 |
0.9985 |
0.2 |
| SiO2 |
22.8 |
48.0 |
0.9896 |
0.8 |
| SO3 |
0.03 |
0.19 |
0.9897 |
0.007 |
| K2O |
0.069 |
0.228 |
0.9935 |
0.006 |
| CaO |
0.13 |
3.11 |
0.9995 |
0.019 |
| TiO2 |
0.02 |
1.36 |
0.9998 |
0.003 |
| Cr2O2 |
0.17 |
1.75 |
0.9971 |
0.02 |
| MnO |
0.11 |
1.94 |
0.9997 |
0.008 |
| Fe2O2 |
12.7 |
46.0 |
0.9986 |
0.4 |
| Co |
0.023 |
0.090 |
0.9839 |
0.003 |
| Ni |
0.05 |
2.94 |
0.9993 |
0.02 |
| Cu |
0.007 |
0.05 |
0.9999 |
0.00014 |
| Zn |
0.007 |
0.035 |
0.9968 |
0.0005 |
Calibration
By relating the element’s characteristic X-Ray intensity to oxide concentration, calibration curves have been attained. X-Ray fluorescence quantifies elements, but the results can be directly attributed to the oxide forms of these elements when only one distinct type of oxide is found in the sample.
Figures 1 to 14 demonstrate the calculated versus given concentration plots acquired for MgO, Ni, SiO₂, Al₂O₃, K₂O, SO₃, TiO₂, CaO, MnO, Cr₂O₃, Co, Fe₂O₃, Zn and Cu.
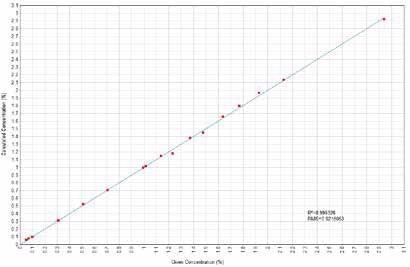
Figure 1. Ni Calculated versus Given Concentrations. Image Credit: Thermo Fisher Scientific – Materials & Structural Analysis
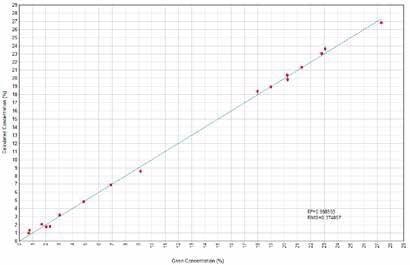
Figure 2. MgO Calculated versus Given Concentrations. Image Credit: Thermo Fisher Scientific – Materials & Structural Analysis
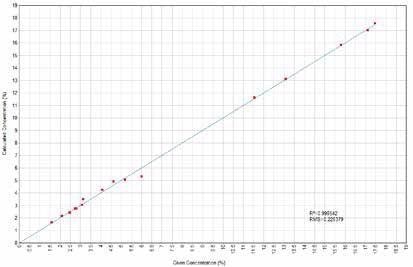
Figure 3. Al2O3 Calculated versus Given Concentrations. Image Credit: Thermo Fisher Scientific – Materials & Structural Analysis
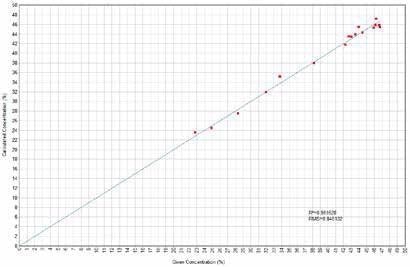
Figure 4. SiO2 Calculated versus Given Concentrations. Image Credit: Thermo Fisher Scientific – Materials & Structural Analysis
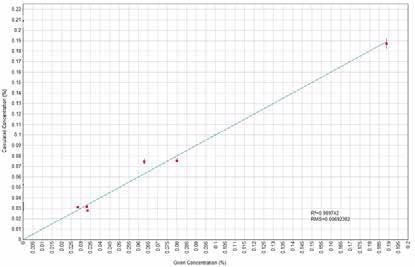
Figure 5. SO3 Calculated versus Given Concentrations. Image Credit: Thermo Fisher Scientific – Materials & Structural Analysis
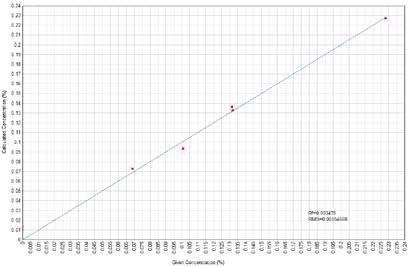
Figure 6. K2O Calculated versus Given Concentrations. Image Credit: Thermo Fisher Scientific – Materials & Structural Analysis
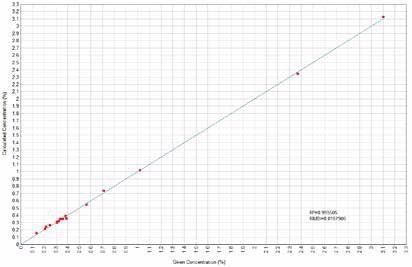
Figure 7. CaO Calculated versus Given Concentrations. Image Credit: Thermo Fisher Scientific – Materials & Structural Analysis
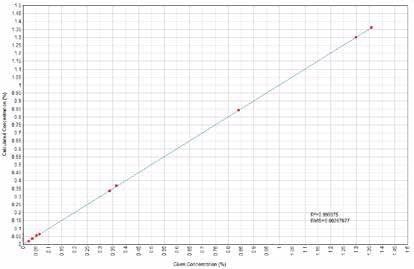
Figure 8. TiO2 Calculated versus Given Concentrations. Image Credit: Thermo Fisher Scientific – Materials & Structural Analysis
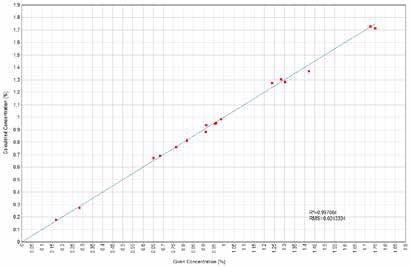
Figure 9. Cr2O3 Calculated versus Given Concentrations. Image Credit: Thermo Fisher Scientific – Materials & Structural Analysis
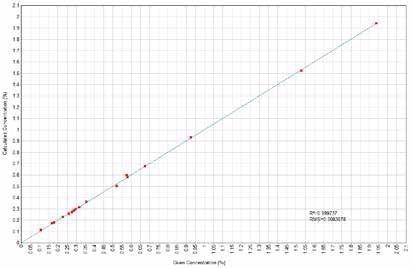
Figure 10. MnO Calculated versus Given Concentrations. Image Credit: Thermo Fisher Scientific – Materials & Structural Analysis
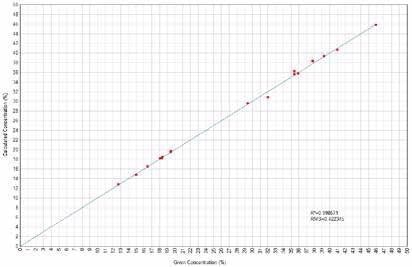
Figure 11. Fe2O3 Calculated versus Given Concentrations. Image Credit: Thermo Fisher Scientific – Materials & Structural Analysis
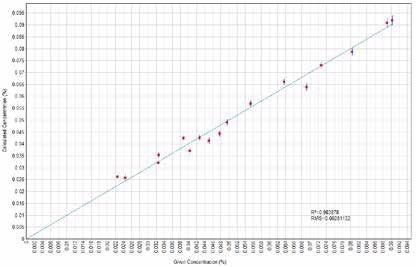
Figure 12. Co Calculated versus Given Concentrations. Image Credit: Thermo Fisher Scientific – Materials & Structural Analysis
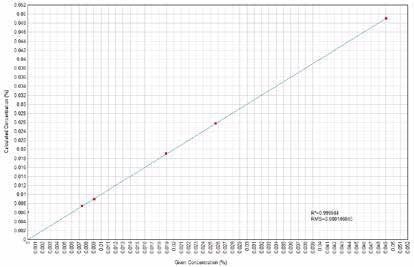
Figure 13. Cu Calculated versus Given Concentrations. Image Credit: Thermo Fisher Scientific – Materials & Structural Analysis

Figure 14. Zn Calculated versus Given Concentrations. Image Credit: Thermo Fisher Scientific – Materials & Structural Analysis
Validation
To validate the calibration, two nickel ore reference materials (192 and 199) were used. Table 3 presents the results of the analysis for these reference materials.
Table 3. Accuracy of results for standards 192 and 199 using ARL QUANT’X Spectrometer. Source: Thermo Fisher Scientific – Materials & Structural Analysis
| |
MgO % |
Al2O3 % |
SiO2 % |
SO3 % |
K2O % |
CaO % |
TiO2 % |
Cr2O3 % |
MnO % |
Fe2O3 % |
Co % |
Ni % |
Cu % |
Zn % |
| 192 Reference |
21.32 |
2.76 |
43.58 |
- |
- |
0.313 |
0.036 |
0.9129 |
0.277 |
18.1 |
0.0404 |
1.77 |
- |
0.0176 |
| 192 Analysis |
21.86 |
2.61 |
43.97 |
0.03 |
0.0104 |
0.308 |
0.034 |
0.8854 |
0.269 |
18.2 |
0.0376 |
1.80 |
0.0060 |
0.0164 |
| 199 Reference |
0.742 |
17.47 |
24.93 |
0.08 |
0.069 |
0.208 |
0.842 |
0.686 |
1.94 |
41.01 |
0.0554 |
0.0995 |
0.0189 |
0.0198 |
| 199 Analysis |
0.880 |
17.94 |
24.58 |
0.07 |
0.0724 |
0.213 |
0.840 |
0.695 |
1.95 |
40.68 |
0.0566 |
0.0984 |
0.0189 |
0.0206 |
CRM reference values are compared with the average of 10 replicate analyses of the two CRMs, whereas Tables 4a and 4b present the repeatability results for each CRM.
Table 4a. Repeatability results for standards 192 using ARL QUANT’X Spectrometer. Source: Thermo Fisher Scientific – Materials & Structural Analysis
| |
MgO % |
Al2O3 % |
SiO2 % |
SO3 % |
K2O % |
CaO % |
TiO2 % |
Cr2O3 % |
MnO % |
Fe2O3 % |
Co % |
Ni % |
Cu % |
Zn % |
| Repeats 01 |
21.853 |
2.574 |
44.171 |
0.032 |
0.0104 |
0.307 |
0.034 |
0.885 |
0.269 |
18.187 |
0.036 |
1.803 |
0.0060 |
0.0164 |
| Repeats 02 |
21.992 |
2.565 |
43.843 |
0.031 |
0.0104 |
0.309 |
0.032 |
0.882 |
0.266 |
18.175 |
0.038 |
1.803 |
0.0060 |
0.0158 |
| Repeats 03 |
21.785 |
2.633 |
44.018 |
0.032 |
0.0104 |
0.307 |
0.034 |
0.886 |
0.268 |
18.174 |
0.039 |
1.802 |
0.0060 |
0.0164 |
| Repeats 04 |
21.843 |
2.625 |
43.916 |
0.029 |
0.0104 |
0.308 |
0.033 |
0.886 |
0.270 |
18.202 |
0.037 |
1.800 |
0.0060 |
0.0164 |
| Repeats 05 |
21.448 |
2.712 |
44.334 |
0.033 |
0.0104 |
0.308 |
0.038 |
0.886 |
0.270 |
18.209 |
0.036 |
1.807 |
0.0060 |
0.0167 |
| Repeats 06 |
21.950 |
2.589 |
43.882 |
0.032 |
0.0104 |
0.307 |
0.034 |
0.888 |
0.268 |
18.188 |
0.037 |
1.800 |
0.0060 |
0.0162 |
| Repeats 07 |
21.901 |
2.607 |
43.973 |
0.030 |
0.0104 |
0.307 |
0.030 |
0.886 |
0.270 |
18.173 |
0.039 |
1.804 |
0.0060 |
0.0167 |
| Repeats 08 |
21.958 |
2.586 |
43.913 |
0.028 |
0.0104 |
0.306 |
0.034 |
0.886 |
0.270 |
18.199 |
0.038 |
1.803 |
0.0060 |
0.0165 |
| Repeats 09 |
21.950 |
2.626 |
43.707 |
0.031 |
0.0104 |
0.308 |
0.038 |
0.888 |
0.269 |
18.185 |
0.038 |
1.802 |
0.0060 |
0.0163 |
| Repeats 10 |
21.964 |
2.581 |
43.964 |
0.030 |
0.0104 |
0.310 |
0.035 |
0.882 |
0.271 |
18.198 |
0.040 |
1.804 |
0.0060 |
0.0166 |
| Average |
21.864 |
2.610 |
43.972 |
0.031 |
0.0104 |
0.308 |
0.034 |
0.885 |
0.269 |
18.189 |
0.038 |
1.803 |
0.0060 |
0.0164 |
| 1-Sigma |
0.160 |
0.043 |
0.175 |
0.002 |
- |
0.001 |
0.002 |
0.002 |
0.001 |
0.013 |
0.001 |
0.002 |
- |
0.0003 |
| % RSD |
0.73 |
1.65 |
0.40 |
4.86 |
- |
0.32 |
6.95 |
0.23 |
0.51 |
0.07 |
3.34 |
0.12 |
- |
1.62 |
| Minimum |
21.448 |
2.565 |
43.707 |
0.028 |
0.0104 |
0.306 |
0.030 |
0.882 |
0.266 |
18.173 |
0.036 |
1.800 |
0.0060 |
0.0158 |
| Maximum |
21.992 |
2.712 |
44.334 |
0.033 |
0.0104 |
0.310 |
0.038 |
0.888 |
0.271 |
18.209 |
0.040 |
1.807 |
0.0060 |
0.0167 |
Table 4b. Repeatability results for standards 199 using ARL QUANT’X Spectrometer. Source: Thermo Fisher Scientific – Materials & Structural Analysis
| |
MgO % |
Al2O3 % |
SiO2 % |
SO3 % |
K2O % |
CaO % |
TiO2 % |
Cr2O3 % |
MnO % |
Fe2O3 % |
Co % |
Ni % |
Cu % |
Zn % |
| Repeats 01 |
1.009 |
17.750 |
24.609 |
0.069 |
0.074 |
0.213 |
0.845 |
0.696 |
1.943 |
40.653 |
0.056 |
0.098 |
0.0191 |
0.0212 |
| Repeats 02 |
1.053 |
17.755 |
24.563 |
0.073 |
0.071 |
0.213 |
0.839 |
0.693 |
1.945 |
40.680 |
0.058 |
0.099 |
0.0192 |
0.0205 |
| Repeats 03 |
0.981 |
17.827 |
24.559 |
0.077 |
0.073 |
0.215 |
0.847 |
0.694 |
1.942 |
40.698 |
0.056 |
0.098 |
0.0190 |
0.0209 |
| Repeats 04 |
0.773 |
18.055 |
24.612 |
0.074 |
0.073 |
0.213 |
0.838 |
0.694 |
1.950 |
40.683 |
0.057 |
0.099 |
0.0186 |
0.0208 |
| Repeats 05 |
0.887 |
17.903 |
24.685 |
0.074 |
0.073 |
0.214 |
0.841 |
0.690 |
1.950 |
40.651 |
0.058 |
0.098 |
0.0189 |
0.0208 |
| Repeats 06 |
1.203 |
17.767 |
24.359 |
0.073 |
0.071 |
0.213 |
0.838 |
0.697 |
1.940 |
40.669 |
0.055 |
0.098 |
0.0188 |
0.0196 |
| Repeats 07 |
1.024 |
17.885 |
24.488 |
0.078 |
0.074 |
0.211 |
0.848 |
0.690 |
1.939 |
40.656 |
0.057 |
0.098 |
0.0190 |
0.0209 |
| Repeats 08 |
0.389 |
18.263 |
24.756 |
0.074 |
0.073 |
0.213 |
0.836 |
0.698 |
1.953 |
40.693 |
0.058 |
0.099 |
0.0188 |
0.0202 |
| Repeats 09 |
0.746 |
18.160 |
24.516 |
0.076 |
0.072 |
0.215 |
0.835 |
0.699 |
1.941 |
40.687 |
0.055 |
0.099 |
0.0190 |
0.0210 |
| Repeats 10 |
0.737 |
18.040 |
24.614 |
0.075 |
0.071 |
0.213 |
0.836 |
0.695 |
1.948 |
40.688 |
0.058 |
0.098 |
0.0186 |
0.0204 |
| Average |
0.880 |
17.941 |
24.576 |
0.074 |
0.072 |
0.213 |
0.840 |
0.695 |
1.945 |
40.676 |
0.057 |
0.098 |
0.0189 |
0.0206 |
| 1-Sigma |
0.229 |
0.181 |
0.109 |
0.002 |
0.001 |
0.001 |
0.005 |
0.003 |
0.005 |
0.017 |
0.001 |
0.001 |
0.0002 |
0.0005 |
| % RSD |
26.03 |
1.01 |
0.44 |
3.28 |
1.56 |
0.49 |
0.56 |
0.43 |
0.25 |
0.04 |
2.29 |
0.62 |
1.06 |
2.27 |
| Minimum |
0.389 |
17.750 |
24.359 |
0.069 |
0.071 |
0.211 |
0.835 |
0.690 |
1.939 |
40.651 |
0.055 |
0.098 |
0.0186 |
0.0196 |
| Maximum |
1.203 |
18.263 |
24.756 |
0.078 |
0.074 |
0.215 |
0.848 |
0.699 |
1.953 |
40.698 |
0.058 |
0.099 |
0.0192 |
0.0212 |
Conclusion
This article demonstrates the ARL QUANT’X EDXRF spectrometer’s suitability for the investigation of nickel ore samples. This compact instrument enables nickel ores to be analyzed quickly and reliably.
Repeatability and accuracy results confirm that correct results can be achieved when analyzing pressed powders in air. This is a major benefit for nickel ore mines which frequently operate in remote locations.

This information has been sourced, reviewed and adapted from materials provided by Thermo Fisher Scientific – Materials & Structural Analysis.
For more information on this source, please visit Thermo Fisher Scientific – Materials & Structural Analysis.