Sponsored by HORIBAOct 18 2013
Pigments are playing a key role for coloring of household utensils such as art paints, writings, textiles, plastics and varnishes. However, since they are insoluble in common solvents, they pose some problems during their natural scientific identification, especially in the analysis involving very small sample volume or non-destructive analysis.
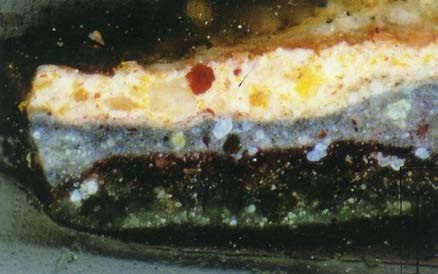
Figure 1. Cut through a painting showing different layers and separated pigments
Art painting analysis (Figure 1) and forensic laboratory analysis are some of the examples involving these analytical problems, which can be solved with Raman spectroscopy. This instrument is a robust analytical method to solve questions of date analysis, product identification, and detection of falsifications.
Significance of Pigment Analysis
Analyzing varnish fragments of cars would help in solving important forensic questions in hit-and-run cases. This kind of analysis is performed by comparing the varnish that is detected in the place of incident happened and defined varnishes of vehicle manufacturers. Pigment analysis is also helpful in the field that relates textiles or plastics to commercial products.
Besides material identification, pigment analysis can be used to acquire data about the age, production methods, restorations or falsifications of arts in the field of art analysis. Besides acquiring historical information, this method supports the valuation of arts.
Role of Raman Spectroscopy
The combination of microscopes and advanced dispersive Raman spectrometers coupled with different laser excitations provides a suite of options for determination of organic and inorganic pigments. Laser wavelengths of 633nm and 785nm are ideally suited to obtain good spectra from white, yellow and red pigments. A green excitation (514.5nm or 532nm) is often preferred for blue and green pigments. More than one laser needs to be used to prevent fluorescence.
High spatial resolution information can be obtained with a microscope. This is made possible with the help of the true confocal entrance optics of the LabRAM, the latest being a completely automated Raman system. Examples of typical pigments exhibiting great differences in the spectra are illustrated in Figures 2, 3, 4, 5, 6 and 7.
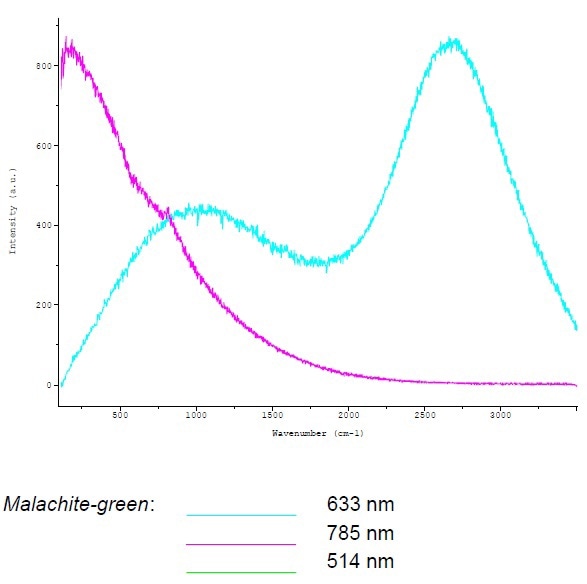
Figure 2. Illustration of spectral differences by typical pigments
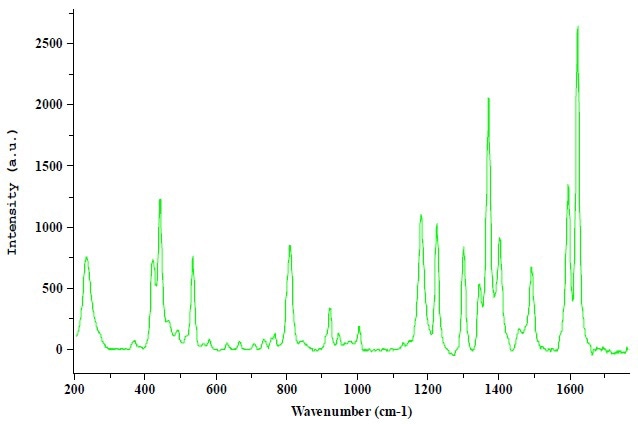
Figure 3. Illustration of spectral differences by typical pigments
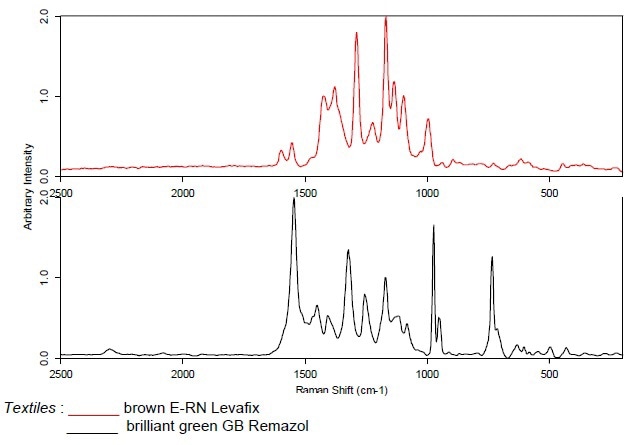
Figure 4. Illustration of spectral differences by typical pigments
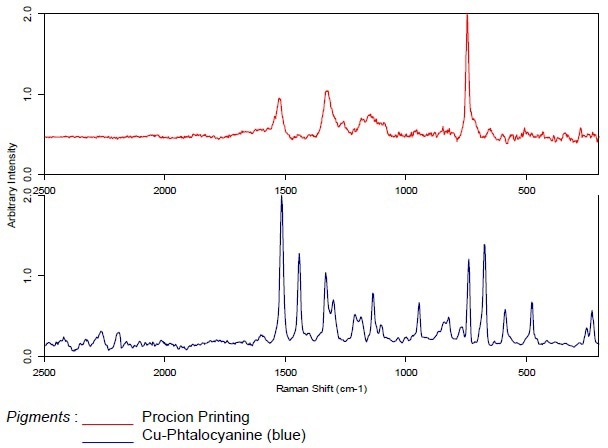
Figure 5. Illustration of spectral differences by typical pigments
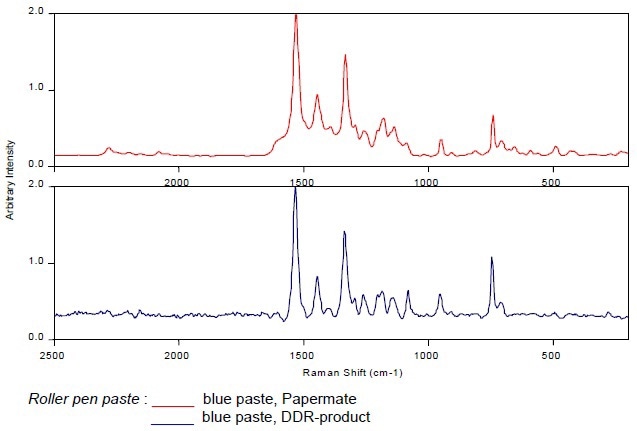
Figure 6. Illustration of spectral differences by typical pigments
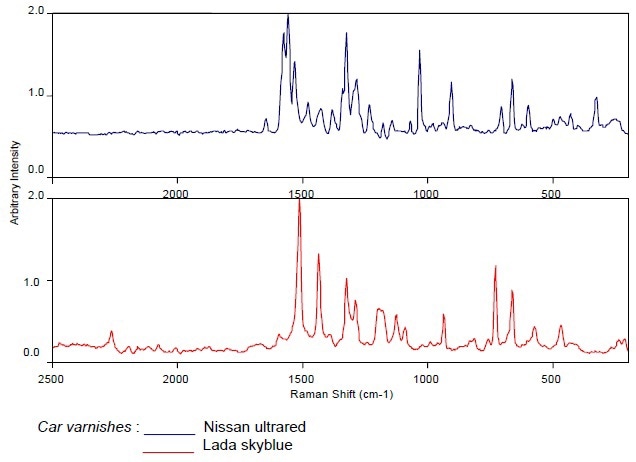
Figure 7. Illustration of spectral differences by typical pigments

This information has been sourced, reviewed and adapted from materials provided by HORIBA.
For more information on this source, please visit HORIBA.