Sponsored by HORIBAOct 18 2013
Grain hardness is the key characteristic of wheat varieties. The milling value relies on this characteristic and corresponds to the ease of fragmentation of the grain kernel. Gaining insights into the molecular basis of the grain cohesion can help in optimizing the milling process (Figure 1) through the selection of more interesting wheat varieties or by the application of specific chemical treatment on commonly raised wheat.

Figure 1. Gaining insights into the molecular basis of the grain cohesion can help optimizing the milling process
This article discusses the spectroscopic characterization of the wheat grain structure. With a high spatial resolution of 1µm, Raman micro spectroscopy can identify specific components of the kernel by means of marker bands. In situ characterization of the secondary structure of wheat protein is achievable with non-destructive Raman micro spectroscopy.
Sample and Instrumentation
Triticum Aestivum wheat grains supplied by INRA Montpellier and by Champagne Céréales were analyzed in this example. A LabRAM Raman microscope was used to perform the Raman analysis utilizing 633nm HeNe laser (normally 8mW on the sample). Raman images comprising 15x11 point analyses were captured on 50µm thick solid sections, acquired with a cryomicrotone.
Spectral Characterization
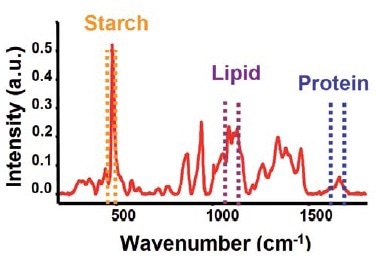
Figure 2. Typical spectral features of protein, lipid and starch
Raman analysis of a starch granule in the wheat grain kernel demonstrates typical spectral features obtained from the protein, lipid and starch present (Figure 2). The presence of these clear marker bands enables Raman mapping to determine the distribution of these components (Figures 3, 4 and 5).
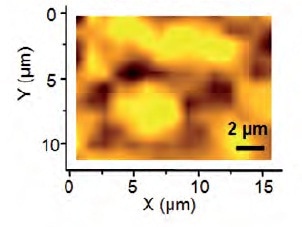
Figure 3. Distribution of starch monitored in the region 471-485cm-1
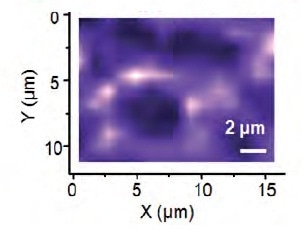
Figure 4. Distribution of lipids monitored in the region 1065-1140cm-1
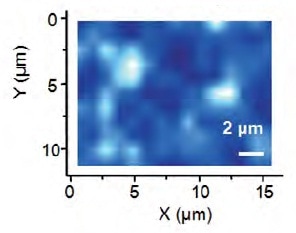
Figure 5. Distribution of proteins monitored in the Amide I region
Hardness of Grain
Careful analysis and band decomposition of the Amide I band (1500-1700cm-1) has enabled establishing a correlation between protein helical structure and grain kernel hardness (Figure 6).
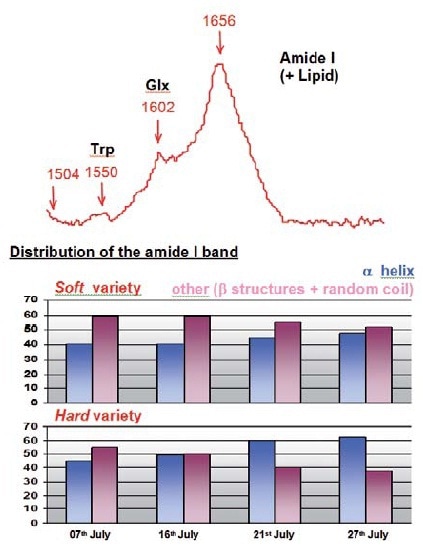
Figure 6. Analysis results
Conclusion
Raman analysis of a 50µm section of a wheat grain kernel has enabled identifying distinct spectral features of proteins, lipids and starch present. A Raman mapped image has helped analyzing the distribution of these components on the micron scale. A correlation between grain hardness and protein structure is established by decomposing the Amide I band.

This information has been sourced, reviewed and adapted from materials provided by HORIBA.
For more information on this source, please visit HORIBA.