Sponsored by m-oemNov 15 2013
Raman spectroscopy is a highly versatile technique that provides a simple, fast and non-destructive analysis of both organic and inorganic chemicals.
This article covers the basics of Raman spectroscopy and it's diverse applications.
Overview of Raman
Raman spectroscopy is a type of molecular spectroscopy that involves the dispersion of electromagnetic radiation by molecules or atoms. It measures the rotational, vibrational, and other low-frequency modes of molecules.
Raman spectroscopy offers several advantages. For instance, this technique is nondestructive and needs little or sample preparation. In fact, Raman analysis can be conducted directly via glasses, jars, plastic bags, cuvettes, and other transparent containers. Moreover, Raman can be used for qualitative as well as quantitative analysis.
This technique is highly selective, which means that it can easily differentiate molecules in chemicals that are very similar. Raman instrumentation is compact, portable and user-friendly. Even a nontechnical user can perform the analysis and quickly obtain the data, thus enabling first responders to adopt suitable precautions depending on the type of materials being searched on the scene.
Raman Spectrometer
A Raman spectrometer includes three main components such as the laser, the sampling interface, and the spectrometer itself. A typical Raman laser will consist of different characteristics, such as a small form factor, low power consumption, narrow linewidth, a stable power output, and a stable wavelength output. In case Raman measurements are conducted using a 785nm source, it is important to ensure that the source is only emitting 785nm.
The second component includes the sampling interface. In many Raman spectrometers, fiber-optic probe is typically used which offers an extremely flexible sampling interface. These fiber-optic probes can be easily adapted to a range of optical microscopes, gas flow cells, liquid flow cells, and other sampling chambers. One critical aspect of a fiber-optic probe is a high-optical-density Raman cutoff. This means, when users are looking at the Raman spectrum, they need to ensure that the laser wavelength is blocked as much as possible so that the Raman shift can be observed. It is extremely important that the Raman shift is observed very close to the laser line since many materials have vital spectral features very near to the line.
The third component is the spectrometer. Here, important performance factors are small form factor, high resolution, low power consumption, and low noise. An appropriate detector is very important and must be utilized depending on which excitation laser is being used. For visible excitation, a standard CCD is selected; for UV excitation, a photomultiplier tube (PMT) or CCD is typically chosen; and for NIR excitation, an indium gallium arsenide (InGaAs) array is normally employed.
Raman Spectrum
Different types of information can be obtained from a Raman spectrum. Every molecule has its own unique Raman spectrum, which can be correlated to a molecular fingerprint. This helps in developing databases of known standards that can be subsequently utilized for verification of unknown standards.
A BWID qualitative software package is utilized to develop databases or spectral libraries. With the help of BWID, users can preprocess some of the information using sample smoothing, baseline corrections, derivatives, etc. Later, methods or models can be developed using partial-least-squares regression or other similar algorithms and employ these models to predict unknowns.

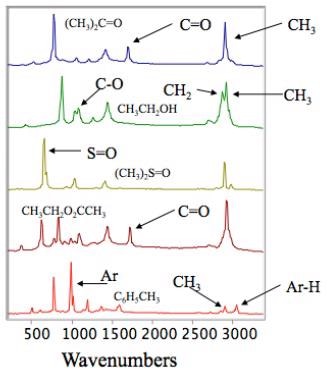
Figure 1. Structural information of different chemicals
Structural information can also be obtained from the Raman technique. In Figure 1, different chemicals are illustrated with their Raman spectrum and different bands can be clearly seen. Each band is related to a particular rotational, vibrational or other low-frequency mode, and each one will constantly remain in the same position, irrespective of whether a 532, 785, or 1064nm excitation light is used.
Applications of Raman
Raman is used in variety of applications. It can be used to identify explosives such as RDX, PETN, TNT, etc. and also the binding agents inside explosive materials. The technique is also effective for identifying toxic solvents in biowarfare agents and for studying other potentially harmful agents. Unlike FTIR spectroscopy, Raman is immune to aqueous absorption bands.

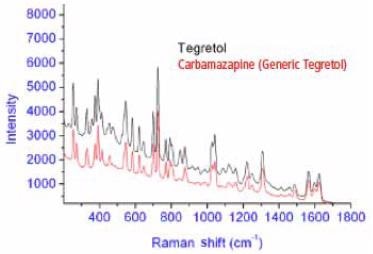
Figure 2. The Raman spectrum for Tegretol is shown along with the spectrum for the generic equivalent (carbamazepine).
In the pharmaceutical industry, one major application for Raman is the detection and substantiation of incoming raw materials. The technique is employed for the analysis of liquids, tablets, and gel caps. Raman is also an essential tool in counterfeit-drug analysis. Figure 2 illustrates the generic form of the carbamazepine drug and the spectra of Tegretol. This analysis was performed without opening the blister packs when looking at these chemicals. Although the variations in the spectra are not visually clear, the BWID software package can easily differentiate the two chemicals. Besides this, Raman technique is used in carbon analysis and bioscience and medical diagnosis.
Conclusion
Raman spectroscopy is a nondestructive technique and can be used with little or no sample preparation. This technique is highly selective and its versatility for both qualitative and quantitative analysis makes it easier to understand how this method can be extensively applied to different types of fields.

This information has been sourced, reviewed and adapted from materials provided by B&W Tek.
For more information on this source, please visit B&W Tek.