The superior corrosion and mechanical properties and low capture cross-section for thermal neutrons make zirconium alloys suitable for use in nuclear reactors. Nevertheless, the formation of hydride particles causes delayed hydrogen cracking (DHC) in zirconium alloys.
This article discusses the application of the electron backscattered technique (EBSD) hydride characterization in terms of the orientation relation of hydrides with the matrix, local misorientation, and internal structure.
Experimental Procedure
Electro-polishing of hydrided electron beam welded zirconium alloy samples was performed using a 10% perchloric acid and 90% methanol electrolyte at -15°C and 20V. The samples were characterized in a FEG SEM using the OI Symmetry detector as well as Oxford Instruments’ AZtecHKL Software.
The SEM was run at 20kV and EBSD data was indexed utilizing the zirconium - Zr (space group 194, a=0.32, b=c=0.51nm) and zirconium hydride -ZrH2 (space group 225, a=b=c=0.48nm) phases.
Experimental Results
Electro-polishing not only retained the hydrides, which are represented as long dark plates with a large aspect ratio in the FSD image in Figure 1, but also polished these particles to produce superior quality EBSPs from them, as shown in a series EBSPs in Figure 2. This, in turn, allowed for successful EBSD mapping as depicted in the series of Figures 3-5.
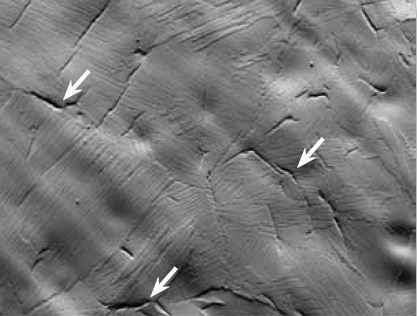
Figure 1. FSD image shows the microstructure of the hydride specimen. Hydrides appear as dark plate like particles with a large aspect ratio, some particles are highlighted with arrows.
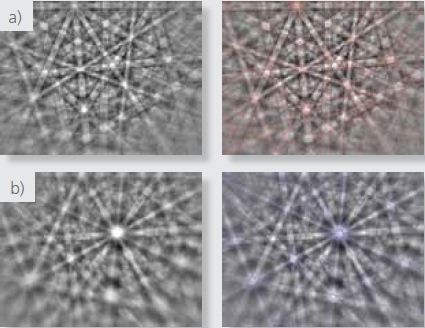
Figure 2. Raw and indexed patterns from a) the matrix and b) from the hydrides
Figure 3a-c depicts a low magnification raw EBSD pattern quality, phase, and IPF Z maps, acquired utilizing the Symmetry detector. The use of a step size of 1μm for this map allowed for indexing only a few pixels in the fine hydride particles.
Nonetheless, the grain structure of the zirconium formed during welding is clearly visible in these maps.
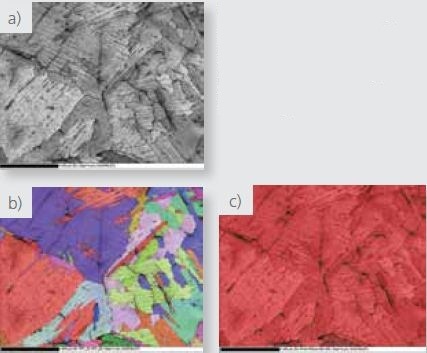
Figure 3. Low magnification a) pattern quality, b) phase where red=zirconium and blue= zirconium hydride and c) IPF Z EBSD maps collected with the Symmetry detector.
Figures 4, 5, and 6 delineate high-resolution high-magnification maps from the zirconium hydride particles. Data depicted in Figures 4 and 5 were acquired using the Symmetry detector, while the NordlysNano detector was used to acquire the data in Figure 6.
These images clearly show that hydride particles are found both intra and trans-granularly and at grain boundaries. The IPF X and Z maps also clearly show the existence of a strong orientation relation between the zirconium matrix and the hydrides.
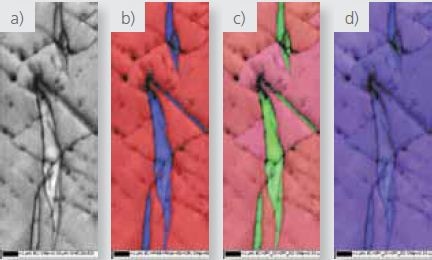
Figure 4. High magnification a) pattern quality, b) phase where red=zirconium and blue= zirconium hydride and c and d) IPF X and Z EBSD maps respectively.
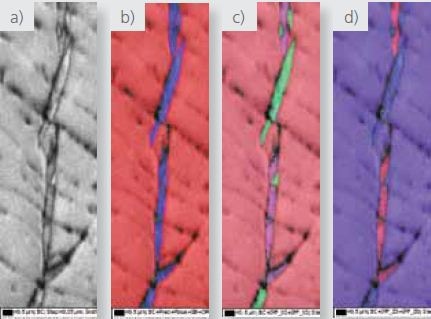
Figure 5. High magnification a) pattern quality, b) phase where red=zirconium and blue= zirconium hydride and c and d) IPF X and Z EBSD maps respectively.
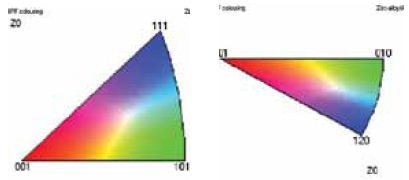
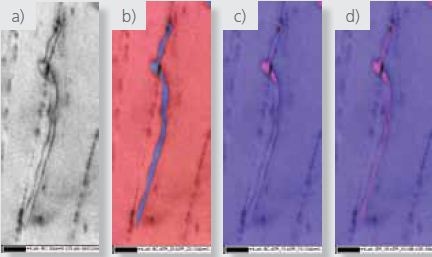
Figure 6. High magnification a) pattern quality, b) phase where red=zirconium and blue= zirconium hydride, c) ) IPF Y and d) IPF Y plus phase boundary maps respectively.
An analysis of the pole figures from these phases depicted in Figure 7 illustrates the existence of the Blackburn’s orientation relation (0002)Zr//(111)hydride and [11-20}Zr//[1-10]hydride between these two phases.
It also reveals that this orientation relation is conserved across boundaries due to the 60° rotation of these boundaries about the [11-20] axis, which offers the requisite (0002) planes on which the same (111) planes in the hydride can continue to form.
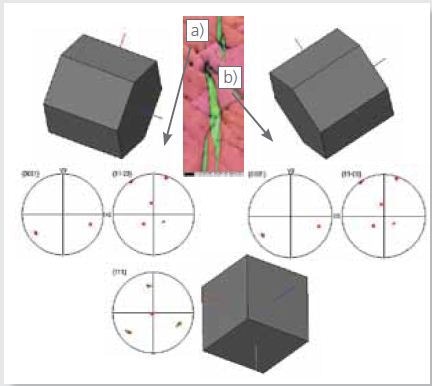
Figure 7. EBSD IPF X map as in Figure 4 and 3D crystal views with respective pole figures
An inspection of the boundaries within the hydride particles in Figure 8 delineates that these are Sigma 3 twin boundaries with an angle axis pair 60° about [111] axis.
Regardless of the twinned boundaries, the Blackburn’s orientation relationship with the matrix is maintained as rotation about the same [111] and the variant in the hydride is conserved about [0002] axis in of the matrix grain.
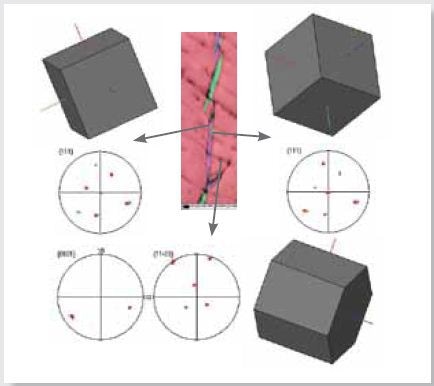
Figure 8. EBSD IPF X map as in Figure 5 and 3D crystal views with respective pole figures
Local misorientation maps for the three data sets in Figures 4-6 are delineated in Figure 9, clearly revealing that hydrides are related to higher misorientations compared to the Zr matrix.
Local misorientations could happen in the particles during their nucleation and growth phase. Moreover, twin boundaries seen in hydrides may have formed to strains accommodated to this process.
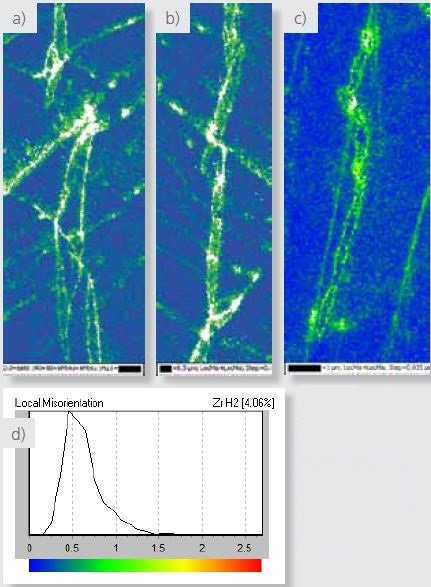
Figure 9. (a, b and c) EBSD local misorientation maps for the maps shown in Figures 4, 5 and 6 respectively. d) local misorientation legend.
Conclusion
Careful preparation of hydrided zirconium alloy can provide samples appropriate for EBSD characterization to gain insights into the orientation relationship between hydrides and matrix as well as the internal structure of the hydrides in terms of twins and local misorientations.

This information has been sourced, reviewed and adapted from materials provided by Oxford Instruments NanoAnalysis.
For more information on this source, please visit Oxford Instruments NanoAnalysis.