Mineral liberation is a key step in the manufacture of mineralogical concentrates from their ores with an appropriate degree of purity for their use in downstream processes.
In this process, the desired minerals are liberated from the original mined ore through comminution (crushing, grinding and classification), followed by enriching the mineral content to the desired level through concentration (froth flotation, gravity separation, magnetic separation).
Gaining insights into the degree of liberation of valuable mineral grains and which form they are lost in tailings (deportment studies) is helpful in designing, diagnosing, monitoring, and optimizing the process.
Oxford Instruments’ INCAMineral
INCAMineral, an add-on to the INCAEnergy software, uses the functionality of INCAFeature to perform efficient analysis of mineral liberation degree. INCAMineral couples image analysis of samples with X-ray analysis of their chemical composition and robust data processing to identify grains and their degree of liberation.
A large-area Ultim® Max detector coupled with INCAMineral provides a versatile SEM to carry out mineral liberation analysis with superior performance and accuracy standards compared to a dedicated system. Moreover, the combination maintains the versatility to conduct the complete range of analytical (e.g. WDS, EBSD) and imaging tasks that can be performed by a SEM without the removal of the specimen from the chamber.
INCAMineral provides a chain of recipes and setup parameters to INCAFeature for particle and mineral grain analysis. The package also features GrainAlyzer, a post-processing program enabling detailed analysis of individual grains and providing in-depth mineral liberation and association reports. This article presents a series of case studies to illustrate the capabilities of INCAMineral. All cases used the workflow shown in Figure 1.
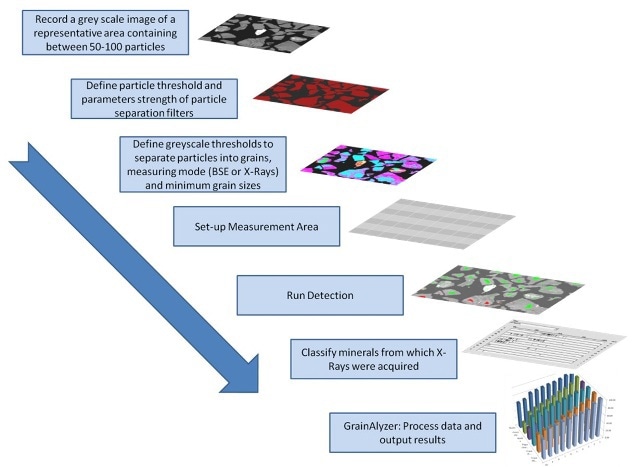
Figure 1. INCAMineral Workflow
Case Study 1 - Liberation of Hematite and Goethite
This case involved the analysis of the liberation of hematite in a high-gradient SLon magnetic separation concentrate from a set of size fractions. Hematite rich iron ore with accessory goethite was the feed material for the magnetic separation, containing below 1% of magnetite and quartz as the main gangue mineral.
The liberation of hematite and goethite from the ore was quantified based on the analysis of grey-level images, while the X-ray data were used to identify the gangue silicates and accessory sulphides. The liberation of quartz and hematite was 77% and 80%, respectively. Goethite occurred closely with hematite and only 35% of goethite reported as liberated grains in the magnetic concentrate. Figure 2 clearly shows the pattern of occurrence and association of hematite with other minerals.
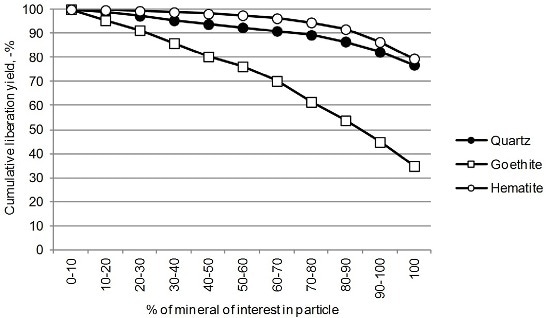
Figure 2. Cumulative liberation yield for hematite, goethite and quartz and association of hematite with other minerals in wt%.
| Mineral |
Liberated |
Binary |
Ternary+ |
Sum |
| Hematite |
71.79 |
8.34 |
10.01 |
90.14 |
| Goethite |
|
1.81 |
3.03 |
4.84 |
| Quartz |
|
1.98 |
1.32 |
3.30 |
| Others |
|
0.40 |
1.33 |
1.72 |
Case Study 2 - Silicate Inclusions in Chromite
The liberation of chromite was determined from a set of samples of different grain sizes and was found to be in the range of 77% to 85%. Reducing size of primary coarse chromite grains resulted only in a slight increase in the degree of liberation owing to a textural feature.
Hence, an extra fine particle size might be required for liberating chromite from a texture of this nature. INCAMineral facilitates the mode of occurrence of inclusions to be analyzed in terms of locking degree even based on individual grains. Figure 3 delineates a chromite grain with silicate inclusions and locking data for each grain in the chromite-silicate particle.

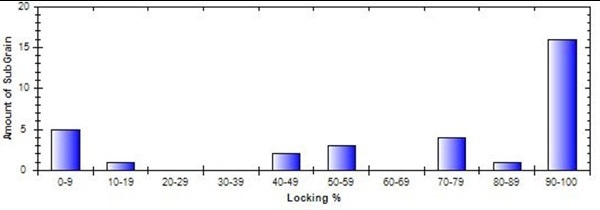
Figure 3. Binary chromite (red) - gangue (grey) – particles with locking distribution data.
Case Study 3 - Liberation of Sphalerite and Galena in Flotation Feed and Tails
The degree of liberation of sphalerite and galena was determined based on size from flotation feed (FF) and flotation tails (FT), as part of an extensive mineralogical process study. The bulk liberation of galena and sphalerite was 77% and 87%, respectively, in the flotation feed.
Sphalerite is lost greatly as liberated grains in the flotation tail, whereas galena is greatly lost to gangue silicates as fine grained inclusions. The bulk liberation of sphalerite and galena in the flotation tails was 67% and 15%, respectively (Figure 3).
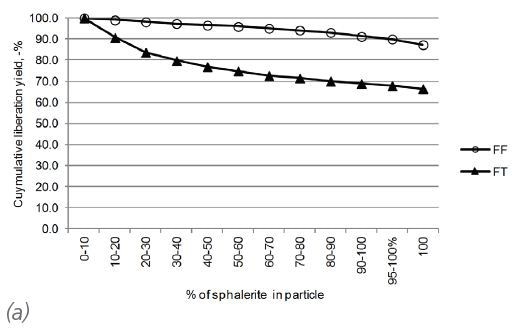
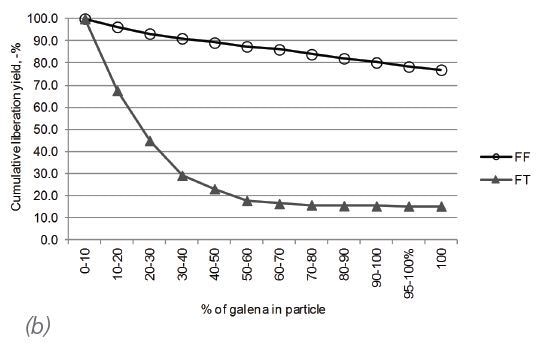
Figure 4. Liberation of a) sphalerite and b) galena in flotation feed (circles) and flotation tails (FT) (triangles) respectively.
Case Study 4- Characterizing Mode of Occurrence of Gold Using INCAFeature Rare Mineral Scan
The INCAMineral rare mineral scan uses BSE images at selected grey level threshold values to find out minerals of interest and acquires X-ray spectra and particle property data. Typically, this kind of analysis targets determining gold and platinum group minerals from process feeds and tails, but may be used to analyze low to trace element concentrations in base metal sulphides and sulphosalts.
The X-ray spectrum, morphological particle properties, chemical composition, and location are collected and stored for each located grain. The saved data enables convenient selection and relocation of grains that need further analysis.
The analysed chemical composition and on-line classification of rare grains identified has proven to offer meaningful advantages process mineralogical studies. Efficient detection of sub-micron grains is achieved with high-resolution field emission gun microscopes (FEG-SEMs).
In this case, the mode of occurrence of gold in a flotation concentrate is characterized utilizing the rare mineral scan mode in INCAFeature and the results are depicted in Figure 5. The liberation of gold is optimized in the coarsest +106µm and in the finest -20µm size fractions, with 81% bulk liberation. The remaining occurs primarily as locked binary particles with pyrite (16%) and only a little portion (3%) as inclusions in pyrite.
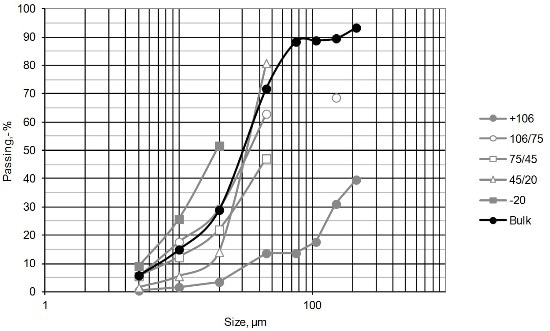
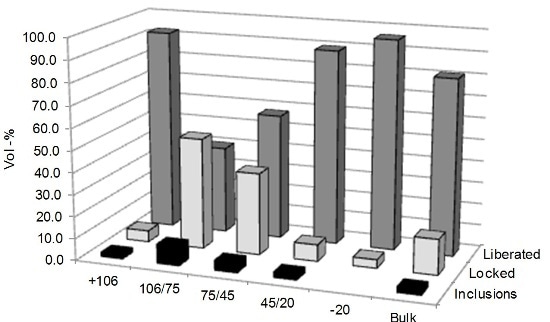
Figure 5. Grain size distribution and mode of occurrence of gold in flotation concentrate.
Conclusion
INCAMineral allows for mineral liberation analysis in a traditional SEM. The results clearly demonstrate the advantages of using a traditional SEM equipped with a large area SDD and INCAMineral for analyzing mineral liberation.
The upgrading of the tool with software of this kind provides an economical approach to maintain the flexibility of the equipment, while allowing the device to perform other functions of which it is capable.
This provides the user the option to apply additional analytical techniques devoid of the removal of the sample from the chamber. This facilitates the WDS analysis of specific minerals that require the highest energy resolution or analysis of specific grains with EBSD to acquire in-depth crystallographic data.

This information has been sourced, reviewed and adapted from materials provided by Oxford Instruments NanoAnalysis.
For more information on this source, please visit Oxford Instruments NanoAnalysis.