The European Medicines Agency (EMA)’s recommendation that all pharmaceutical companies test every single raw material passing through their manufacturing facilities, has drawn great interest in the agricultural, cosmetics, food manufacturing, and nutraceuticals industries, motivating them to develop more stringent and technology-oriented quality control standards.
Recently, handheld Raman technology has earned a lot of commercial popularity in raw materials identification in various industries where conventional analytical methods such as HPLC and NIR spectroscopy have been the primary technologies.
The demand for handheld Raman instrumentation is increasing due to the developments in Raman technology, such as cost-effective, small lasers and detectors with superior sensitivity that have resulted in smaller, faster, less expensive, and more robust analytical tools that need minimum training for use.
Raman technology is considered to be a suitable tool for rapid raw material identification because it requires no direct contact with the sample, no sample preparation, and has the potential to examine a sample through transparent packing material such as plastic or glass.
This article discusses the analysis of four typical ingredients used as excipients for pharmaceutical and nutraceutical products and in the food industry for raw material identification: calcium phosphate dihydrate dibasic, stearic acid, sorbitol, and whey.
A NanoRam® handheld Raman spectrometer from B&W Tek was used to collect the data. The compact, handheld Raman spectrometer has a 785 nm wavelength laser excitation source and an integrated computing system for material identification and verification.
Raw Material Identification Test on NanoRam
With the NanoRam® handheld Raman spectrometer, reliable methods can be rapidly developed for raw material identification and verification using smart principal component analysis (PCA) model building software and on-board spectral libraries.
An unknown compound can be identified within a short time period that is typically less than 30 seconds. This capability makes it a practical choice for rapid identification and verification purposes.
The raw material identification test on the NanoRam begins by developing a method for the raw material to be analyzed. A minimum of 20 spectra are obtained for each material to establish a PCA model for the material, as multiple materials can be used for the 20 spectra.
PCA is a multivariate method, which decreases the dimensionality of the data set by identifying an alternative set of coordinates (i.e. the principal components) that describe the structured variance in the data.
After creating the method for the material, the next step will be to compare the sample spectrum measured with the Nanoram against the PCA model method to see whether it falls within the 95% confidence limit of the model space.
This is followed by calculating a statistical p-value to provide a “Pass” or “Fail” result based on the level of similarity of the unknown material against the method on a 95% confidence level.
A “Pass” result will be obtained if the p-value is higher than or equal to 0.05. A “Fail” result will be returned if the p-value is less than 0.05, suggesting that the sample spectrum is not within the method limits.
Experiment
The analysis was performed using the NanoRam equipped with a point and shoot sampling accessory. The sample measurement was performed through a Whirl-Pak transparent plastic bag.
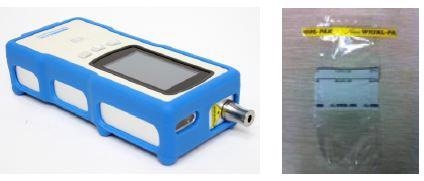
Figure 1. NanoRam and Whirl-Pak transparent plastic bag
Test Results
The raw materials used in this analysis are compounds used in the pharmaceutical industry, cosmetic industry, nutraceutical industry, and the food industry. These compounds include stearic acid, sorbitol, calcium phosphate, and whey protein, which is a blend of immunoglobulins, bovine serum albumin (~8%), alpha- lactalbumin (~25%), and beta-lactoglobulin (~65%) (Figure 2).
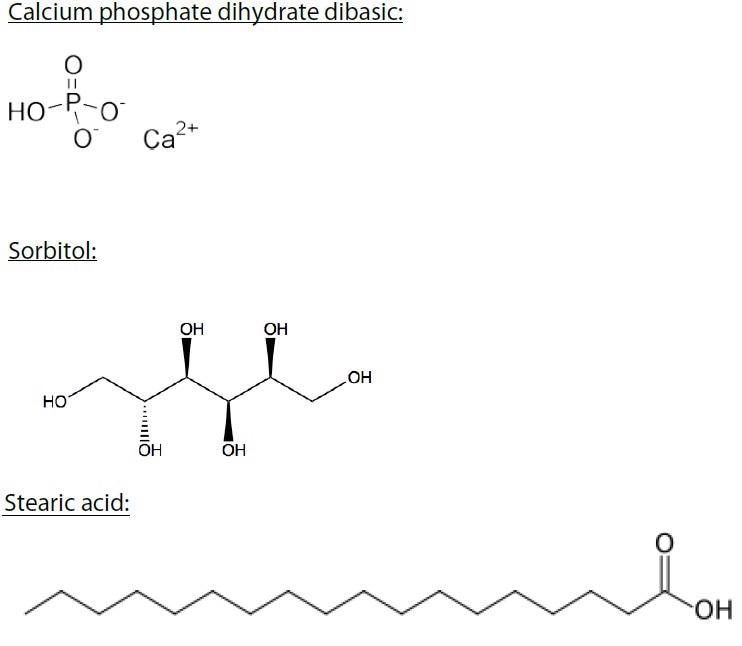
Figure 2. Calcium phosphate dihydrate dibasic, sorbitol, stearic acid, and whey protein were examined in this study
Figure 3 shows the overlaid spectra of calcium phosphate dihydrate dibasic (CaHPO4 • 2H2O), sorbitol (C6H14O6), stearic acid (CH3(CH2)16CO2H), and whey. Distinct Raman spectra are obtained for these compounds, although some spectral overlap can be observed.
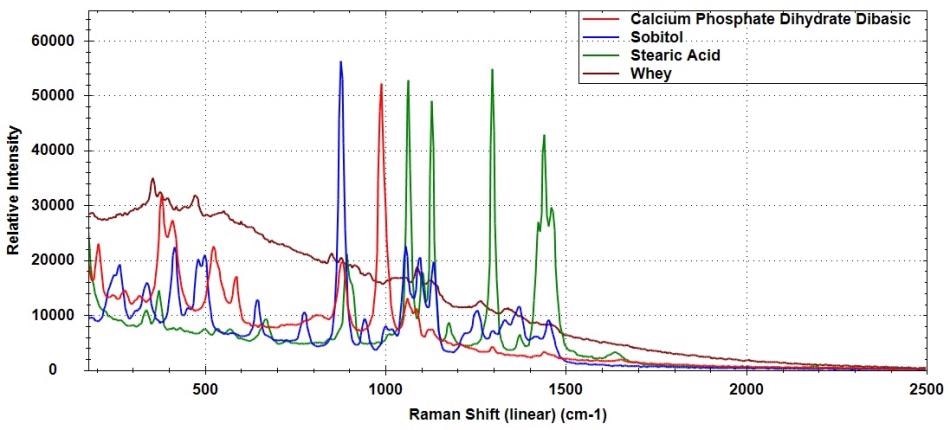
Figure 3. Raman spectra of calcium phosphate dihydrate dibasic, sorbitol, stearic acid, and whey
The NanoRam was used to create the methods “Whey”, “Calcium Phosphate Dihydrate Dibasic”, “Sorbitol”, and “Stearic Acid”. For all methods, the value set for the significance level for passing is 0.05.
All four ingredients passed against their own methods as illustrated in the diagonal line shown in Table 1. All of the ingredients failed the methods for the other ingredients, respectively, allowing the four types of materials to be clearly differentiated.
Table 1. Test Results
Method /
Sample |
Whey |
Calcium Phosphate Dihydrate Dibasic |
Stearic Acid |
Sorbitol |
| Whey |
PASS
(p=1) |
FAIL
(p=0) |
FAIL
(p=0) |
FAIL
(p=0) |
| Calcium Phosphate Dihydrate Dibasic |
FAIL
(p=4.292E-08) |
PASS
(p=0.9919) |
FAIL
(p=0) |
FAIL
(p=0) |
| Stearic Acid |
FAIL
(p=2.819E-07) |
FAIL
(p=0) |
PASS
(p=0.5351) |
FAIL
(p=0) |
| Sorbitol |
FAIL
(p=3.01E-09) |
FAIL
(p=1.321E-14) |
FAIL
(p=0) |
PASS
(p=0.9998) |
Figures 4 to 7 show the “Pass” test result and the corresponding p-value for whey, calcium phosphate dihydrate dibasic, stearic acid and sorbitol, respectively.
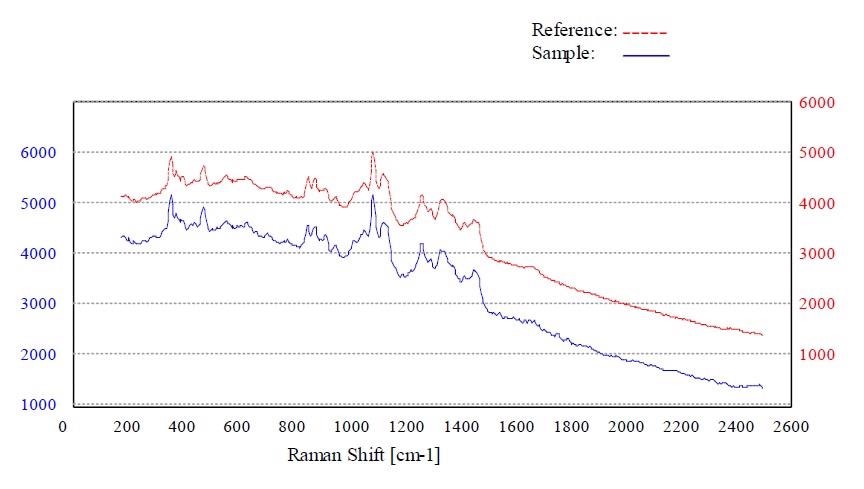
Figure 4. Material whey passed the method “Whey”
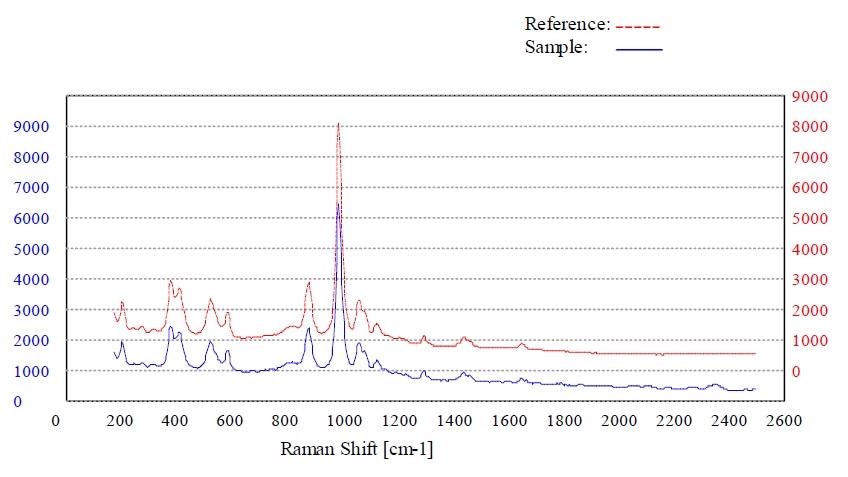
Figure 5. Material calcium phosphate dihydrate dibasic passed the method “Calcium Phosphate Dihydrate Dibasic”
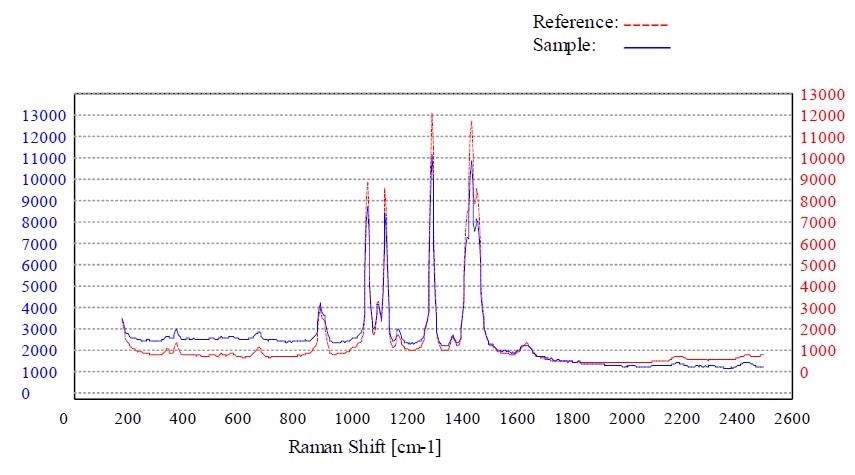
Figure 6. Material stearic acid passed the method “Stearic Acid”
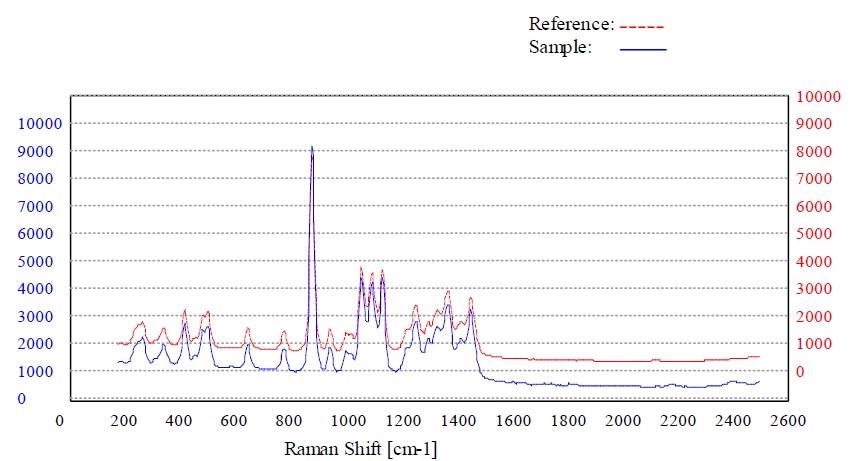
Figure 7. Material sorbitol passed the method “Sorbitol”
Conclusion
The raw materials - calcium phosphate dihydrate dibasic, stearic acid, sorbitol, and whey - all exhibit characteristic Raman signatures. This capability of Raman spectroscopy makes it the most appropriate technology for determining such materials.
Reliable specificity is provided by the PCA model-based method to determine these materials using the methods developed on the NanoRam handheld spectrometer.

This information has been sourced, reviewed and adapted from materials provided by B&W Tek.
For more information on this source, please visit B&W Tek.