A complex arrangement of moderately weak electrostatic interactions drives the colloidal aggregation of proteins. By characterizing a protein’s net charge and non-specific interactions (non-ideality), the estimation of its propensity to develop aggregates, and understanding its viscosity and solubility characteristics in a specific formulation are possible.
The Wyatt Möbius is capable of measuring a charge and non-ideality of protein in one automated experiment.
Non-ideality can be established from the diffusion interaction parameter, kD, while charge can be established from electrophoretic mobility. The Möbius uses phase analysis light scattering (PALS) to quantify the electrophoretic mobility of macromolecules, and dynamic light scattering (DLS) to measure kD.
DLS also offers data on the radius (rh) so that the net charge can be calculated from the radius and the mobility using the Debye-Henry-Hückel formula:

where η represents the solution viscosity, κ is the inverse Debye length, and f1 is Henry’s function. The Debye-Henry-Hückel charge typically signifies colloidal stability, as illustrated in Table 1.
Table 1. Effective charge and Debye-Henry-Huckel charge and corresponding predicted protein stability. Courtesy of Dr. Tom Laue, Biomolecular Interactions Technology Center, University of New Hampshire.
| Zeffective |
ZDHH |
Colloidal Stability |
| 0 to 0.5 |
0 to 1.5 |
Coagulation/Flocculation |
| 1 to 3 |
3 to 9 |
Incipient Instability |
| 3 to 4 |
9 to 12 |
Moderate Stability |
| 4 to 6 |
12 to 18 |
Good Stability |
| > 6 |
>18 |
Excellent Stability |
While charge can occasionally be used as an exclusive predictor of a protein’s stability, solubility, and viscosity, a second protein stability indicator, the diffusion interaction parameter (kD) is applied to comprehend the residual interactions caused by other phenomena happening on the protein’s surface.
DLS is used to measure the diffusion interaction parameter, and compares well with the second virial coefficient, B22, or A2 quantified with multi-angle static light scattering. The second virial coefficient is a measurement of non-specific solute-solute interactions, which comprise of van der Waals interactions, dipole-dipole interactions, and hydrophobic effects.
A positive A2 or kD value signifies unappealing interactions, and a negative A2 or kD value shows appealing interactions. Appealing interactions are usually a reflection of a poor stability of proteins, as aggregation is probably caused by these interactions. Buffer salinity, excipients, and pH influence these interactions, so their measurement is an important tool for the development of formulations.
kD is computed from a linear fit of diffusion coefficient (D) versus concentration (c) as follows:
D=D0 (1+ kDc+ ...)
The Möbius conducts concurrent, independent PALS and DLS measurements, making it a suitable tool for protein characterization.
In this analysis, charge and kD for two antibodies are compared. One is considered to be stable under many conditions and the other has poor stability.
Materials and Methods
An Agilent 1260 HPLC was interfaced with a Wyatt Atlas™ and Möbius for full automation of these experiments. The sample was placed into the Mobius flow cell with the aid of an Autosampler, and the sample chamber was subsequently pressurized with the aid of Atlas accessory, preventing the development of electrolysis bubbles while performing mobility measurements. All data was gathered using the DYNAMICS software.
Using 10 mM NaCl, 10 mM Histidine, pH 6.7, samples were dialyzed into formulation buffer. The concentrations of antibody were in the range of about 2 to 10 mg/mL for both Protein 1 and Protein 2.
Using the DYNAMICS software, automated measurements of only DLS were performed, followed by a concurrent DLS and PALS measurement for each concentration. DLS was measured before applying the current to ensure that the sample’s behavior is not affected by the current.
Diffusion coefficients versus concentration were equipped to locate kD for both antibodies, and the average charge was measured.
Results and Discussion
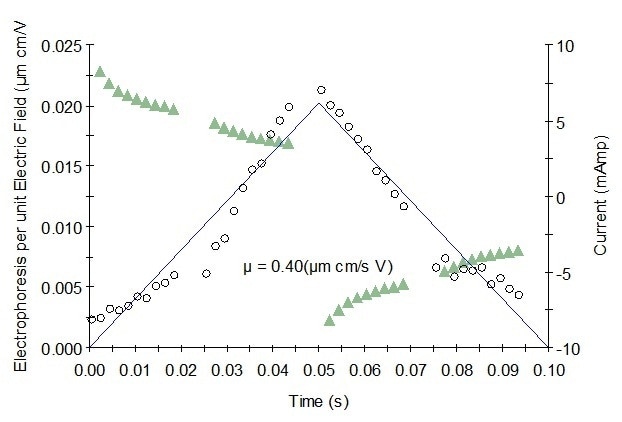
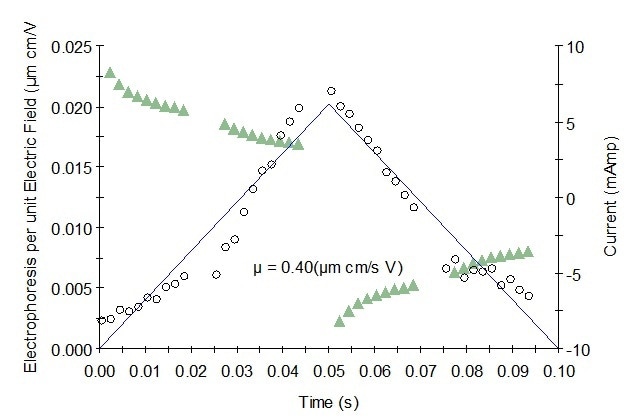
The average charge was almost the same for the two antibodies: 8.4 and 6.1 for Protein 1 and for Protein 2, respectively (Figures 1 and 2), demonstrating that both antibodies can be expected to display ‘Incipient Instability’ (Table 1).

Figure 1. Representative mobility graph for Protein 1 showing mobility data (o), fit, and current (Δ).

Figure 2. Representative mobility graph for Protein 2 showing mobility data (o), fit, and current (Δ).
Conversely, Protein 1 shows poor stability, while Protein 2 shows superior stability, so it is unexpected that the charge is similar. In this situation, the kD measurement supplies important data regarding the solution behavior of these antibodies.
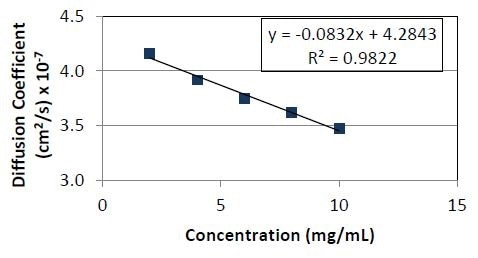
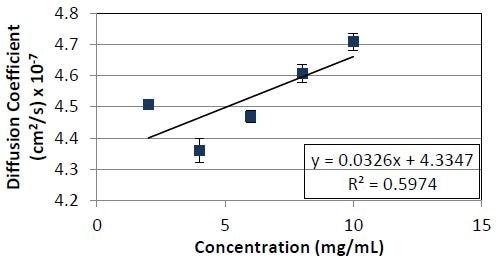
As seen in Figures 3 and 4, Protein 1 has a negative kD, while Protein 2 has a positive kD ; Protein 1’s negative kD explains its inclination to form aggregates.

Figure 3. Diffusion coefficient as a function of concentration for Protein 1. The slope divided by the y- intercept yields a kD value of -1.9 x 10⁻²ml/mg.

Figure 4. Diffusion coefficient as a function of concentration for Protein 2. The slope divided by the y- intercept yields a kD value of 7.5 x 10⁻²ml/mg.
Conclusion
Charge and diffusion interaction parameters are vital as they reveal colloidal stability, but charge alone cannot always provide a comprehensive picture of the factors impacting stability. Although the existence of a net charge offers stability, a molecule can possess a favorable net charge but can become de-stabilized when exposed to localized electrostatics such as a dipole moment and hydrophobic residues.
The Wyatt Möbius is designed with the unique ability to measure kD and charge in a single automated experiment. This capability offers a highly comprehensive picture of factors impacting the stability of a protein than either individual measurement.
Reference
'Adapted from "Self-Association of Insulin Quantified by CG-MALS" white paper by Wyatt Technology. Graphs and illustrations reprinted with permission from Wyatt Technology.’

This information has been sourced, reviewed and adapted from materials provided by Wyatt Technology.
For more information on this source, please visit Wyatt Technology.