Raman spectroscopy is a popular and well-developed technique used for molecular identification. It is extensively used for qualitative analysis and it provides fast material identification, usually at the point of delivery or use.
As Raman can provide high resolution, it is also used for both quantitative analysis and structural elucidation. Raman can even be used to determine aqueous solutions, making it comparatively better than other molecular spectroscopic tools.
In this article, a quantitative calibration model is developed to establish the concentrations of sucrose, glucose, and fructose in a tertiary aqueous mixture using a combination of B&W Tek’s portable i-Raman® Plus and BWIQ® chemometric modeling software.
The multivariate analysis software package, BWIQ was specifically developed for spectral data analysis. It can be used to investigate the associations between spectra and sample classes or spectra and response data.
The software integrates traditional chemometric techniques such as principal component analysis (PCA) and partial least squares regression (PLSR) with innovative techniques such as support vector machine (SVM) algorithms and adaptive iteratively reweighted Penalized Least Squares (airPLS).
Experiment and Results
B&W Tek’s i-RamanPlus was selected for this analysis, as it is the most sensitive portable Raman spectrometer available on the market. Spectra was collected through glass scintillation vials using a fiber-optic probe.
Following an experimental design, a set of 31 standard samples with known quantities of sucrose, glucose, and fructose in distilled water were prepared to develop a calibration curve. 0.4 M of sugar was the overall concentration in each samples. Raman spectra were collected over the 176- 3200 cm-1 range under the following conditions:
- An integration time of 50 seconds
- 785 nm excitation wavelength set to approximately 300 mW power output
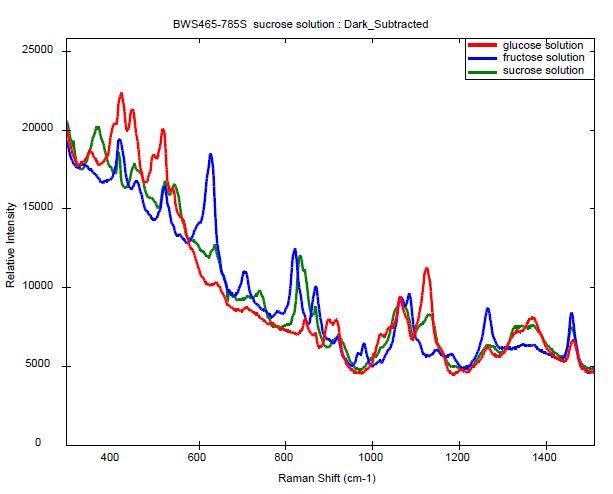
Figure 1 shows the representative spectra of the solutions of individual sugars. 62 spectra, with each sample scanned in duplicate, were collected with different concentrations of the three constituents and transferred to the BWIQ software for further analysis.
For the calibration set, a total of 50 spectra, with 25 samples scanned in duplicate were selected. For the prediction set, the remaining 12 spectra were used.
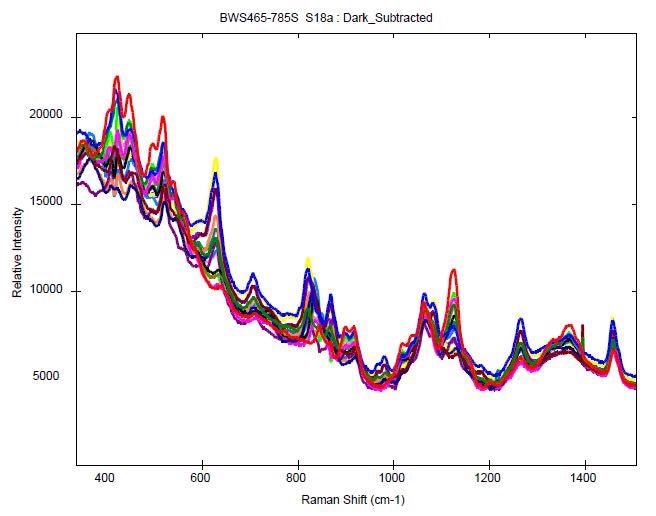
The data was subsequently used without any need for preprocessing and a calibration curve was produced using PLS1 regression on the data over the 250 - 1500 cm-1 spectral region. Figure 2 shows an overlay of samples with different concentrations.

Figure 1. Raman spectra of aqueous sugar solutions

Figure 2. Overlay of Raman spectra of tertiary solutions of glucose, fructose and sucrose.
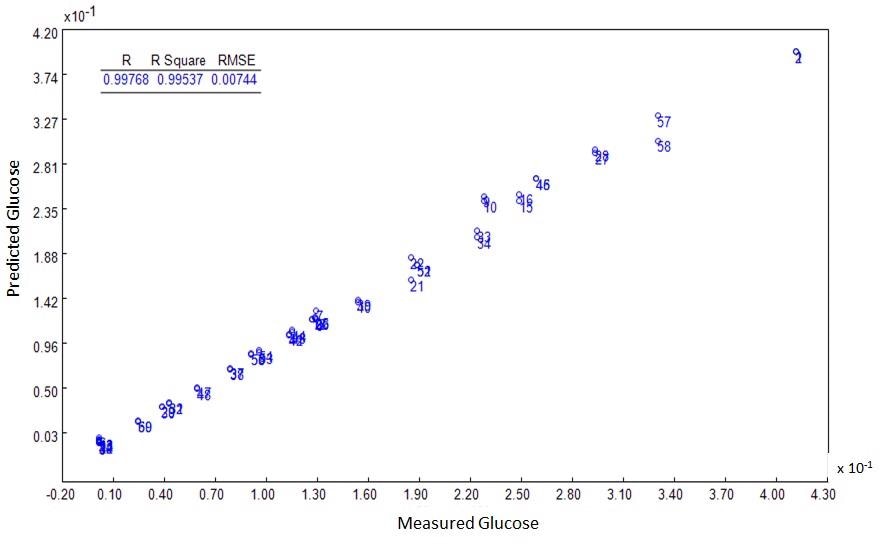
For each of the three components, a three factor PLS model was developed and the concentrations were plotted to demonstrate the model accuracy. Figure 3 shows the results obtained for glucose, displaying an R2 value higher than 0.999 for both the predicted and measured concentrations. Similarly, the RMSEP and RMSEC were measured and found to be below 0.008.

Figure 3. Measured vs. predicted plot of concentration percentage for Glucose 3 Factor PLS model.
Using the calibration model designed in the BWIQ multivariate analysis software, samples that were not considered for the calibration set were used as a prediction set. The models were used to effectively determine the samples’ concentration.
Conclusion
This analysis shows the successful use of the i-Raman Plus portable Raman spectrometer coupled with BWIQ software to develop a quantitative model for the determination of glucose concentration in tertiary aqueous mixtures of fructose, sucrose, and glucose.

This information has been sourced, reviewed and adapted from materials provided by B&W Tek.
For more information on this source, please visit B&W Tek.