Sponsored by HORIBAJun 14 2018
RF GDOES is commonly used for very fast elemental depth analysis of both thin and thick films. All elements, including hydrogen (H), can be measured, which is imperative in many areas, such as corrosion studies1, for PV2, in metallurgy3, for the development of hydrogen storage materials4 and for all polymeric coatings studies5.
The most sensitive H emission line is at 121,567 nm, in the VUV range.
Although MS spectrometry is used for isotopic separation, H can be separated from its isotope deuterium (D) in an optical spectrometer that has sufficient resolution: the two emission lines for H and D are at 121,567 nm and 121,534 nm, respectively, separated by 30 picometers.
A D profile is useful in fusion studies of components that encounter plasma6 and in corrosion studies7.
Instrumentation
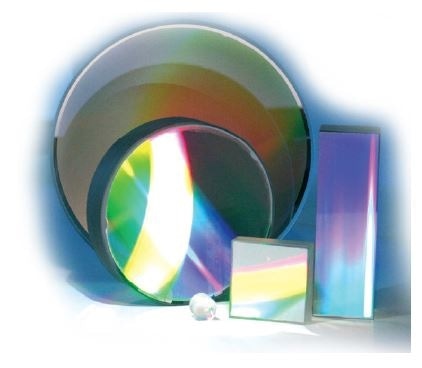
An optical spectrometer that is very effective in the VUV range is required for measuring H and D at their most sensitive wavelengths. This is possible using a dedicated HORIBA grating. The grating is efficient at 2 orders of diffraction, allowing simultaneous measurement of H and D with 2 HDD detectors.


Depth profiles of H, D, Ta, Ti and Ni in the Ta(H)Ti(D)/Ni layered structure (from ref 6)

Sol gel polymeric coating on Al
Plasma Cleaning
The sample is not implanted in a vacuum chamber in GD operation, thus surface contamination is consistently present. Hence, a D profile is preferred in corrosion studies, as it has no ambiguity, whereas H could result from corrosion or surface contamination.
The example below shows the depth profile of a Si sample with implanted H.

Surface H can be minimized using a plasma cleaning operation8, a standard operation in the HORIBA instrument, first introduced in 2009. It exposes the sample to a plasma which is very low energy (typically less than 3 W in pulsed operation mode, inducing no sputtering), but active enough to induce surface desorption in the sample.

Plasma cleaning condition

N. Pushilina at the 7th GD day did show a calibration of H in Ti samples obtained after adequate optimization of the plasma cleaning.
H at Interfaces
If H at the surface can be related to surface contamination, an H peak at an interface could be linked to the presence of a residual layer or to a void in the sample. The examples below correlate GD profiles with H peaks to TEM cross-sections with voids.

H detection. Presence of Voids.
References and Further Reading
- Marie Dumerval et al, “Hydrogen absorption associated with the corrosion mechanism of 316L stainless steels in primary medium of Pressurized Water Reactor (PWR)” Corrosion Science http://dx.doi.org/10.1016/j.corsci.2014.04.025
- S. Gaiaschi et al. “Structural properties of hydrogenated microcrystalline silicon–carbon alloys deposited by Radio Frequency Plasma Enhanced Chemical Vapor Deposition: Effect of microcrystalline silicon seed layer and methane flow rate” Thin Solid Films 550 (2014) 312–318.
- F. Cemin et al. “On the hydrogenated silicon carbide (SiCx:H) interlayer properties prompting adhesion of hydrogenated amorphous carbon (a-C:H) deposited on steel” Vacuum 10.1016/j.vacuum.2014.07.015.
- V. Knotek et al. “Electrochemical hydriding of Mg-Ni-Mm(Mm [ mischmetal) alloys as an effective method for hydrogen storage” International Journal of Hydrogen Energy 38 (2013) 3030-3040.
- V. Moutarlier et al. “Glow discharge optical emission spectroscopy: a complementary technique to analyze thin electrodeposited polyaniline films” Thin Solid Films 550 (2014) 27–35.
- Y. Hatano et al. “Measurement of deuterium and helium by glow-discharge optical emission spectroscopy for plasma–surface interaction studies” Fusion Engineering and Design doi:10.1016/j.fusengdes.2012.02.078.
- H. Nakamura et al. “Deuterium behavior at the interface of oxidized metal under high temperature heavy water” Fusion Engineering and Design doi:10.1016/j.fusengdes.2012.02.044.
- Igor Molchan et al. “The concept of plasma cleaning in glow discharge spectrometry” JAAS J. Anal. At. Spectrom., 2009, 24, 734–741.

This information has been sourced, reviewed and adapted from materials provided by HORIBA.
For more information on this source, please visit HORIBA.