Amorphous and crystalline silicon, a-Si and c-Si, respectively, are widely utilized in thin film solar cells. A well-known microstructure of these materials is vital for the successful thin film technology development.
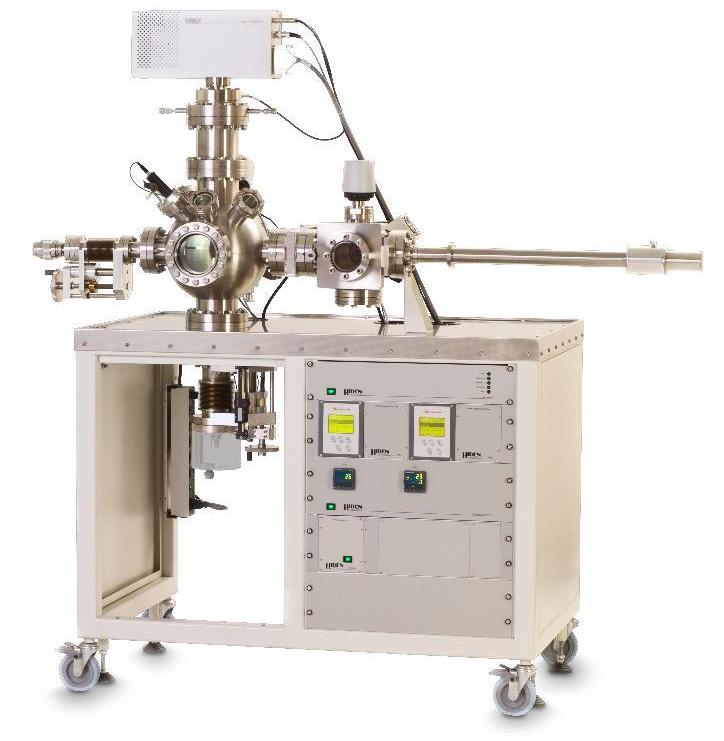
Hiden TPD Workstation. Image Credit: Hiden Analytical
Differences in microstructures can rely, for example, on the substrate temperature, the deposition technique, the annealing state, alloying and doping [1]. The thermal stability at higher temperatures [2] and the surface passivation of novel thin film materials are crucial [3] when used in solar cells.
Temperature Programmed Desorption (TPD), also known as Thermal Desorption Spectrometry (TDS) or Thermal Desorption Analysis (TDA) is a good technique for examining the microstructure of thin films via thermal effusion measurements.
Analysis by TPD involves positioning the sample in an Ultra High Vacuum (UHV) chamber and heating the sample at different linear temperature ramp rates while gathering the desorption spectra via a quadrupole mass spectrometer.
The Hiden TPD Workstation is a complete experimental setup that is made for this and a number of other applications and is optimized to attain maximum sensitivity for desorption species which are ranged from 1 – 300 amu.
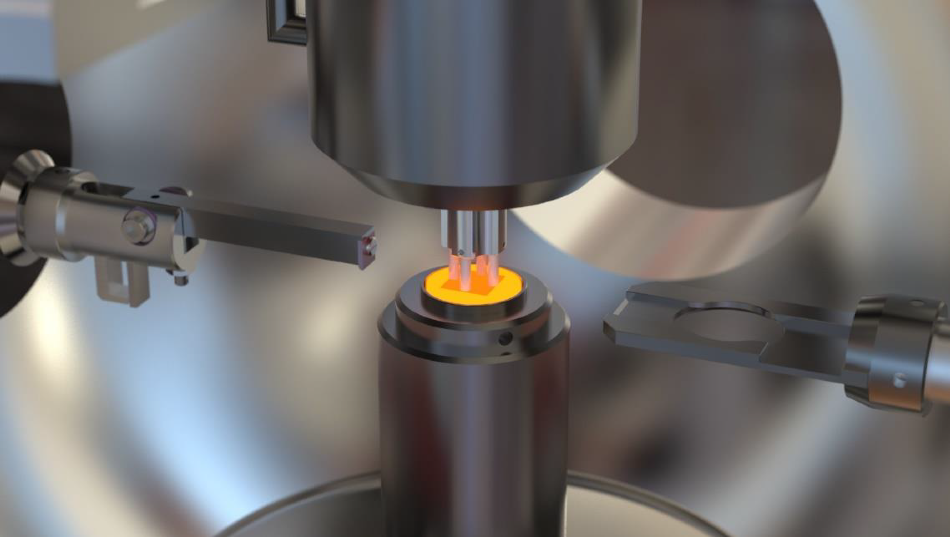
TPD sample under analysis. Image Credit: Hiden Analytical
Example Data
Optimization of Sensitivity
The Hiden TPD Workstation has multiple features designed to optimize the sensitivity of the system for low level desorption products. These include:
- Cooled mass spectrometer shroud to minimize background contributions
- No sample holder – only the sample enters the UHV chamber meaning no outgassing components except for the sample
- Close coupling between the mass spectrometer and sample for optimum desorption profile and maximum sensitivity
- High sensitivity triple filter PIC quadrupole mass spectrometer
Silicon Surface Analysis
In this case, a Si wafer was coated with Al2O3 and examined by utilizing the TPD Workstation. At a constant rate of 30 °C/min, the sample was heated to 1000 °C. A 1-50 amu bar scan was carried out during the temperature ramping in order to detect the desorbing species. The complete mass range analyzed is shown in the 3D plot below.
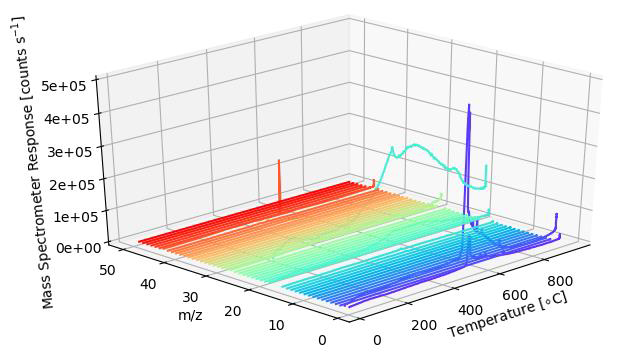
Image Credit: Hiden Analytical
The main desorbing species seen can be observed in the plot which is derived from the 1 – 50 amu bar scan data (3D plot), namely 1 – H, 2 – H2, 17 – HO, 18 – H2O, 28 – CO, 44 – CO2.
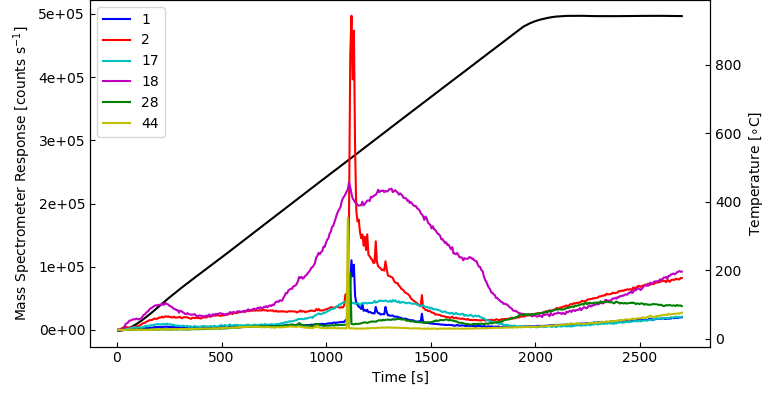
Image Credit: Hiden Analytical
High-Resolution Analysis
In a further TPD run using a fresh sample of the same material, the desorbing species of interest, in this case hydrogen, water and carbon dioxide, were quantified again with a multiple ion detection (MID) scan which gives a higher time, i.e. temperature resolution for the desorbed species of interest. The result can be seen in the below plot.
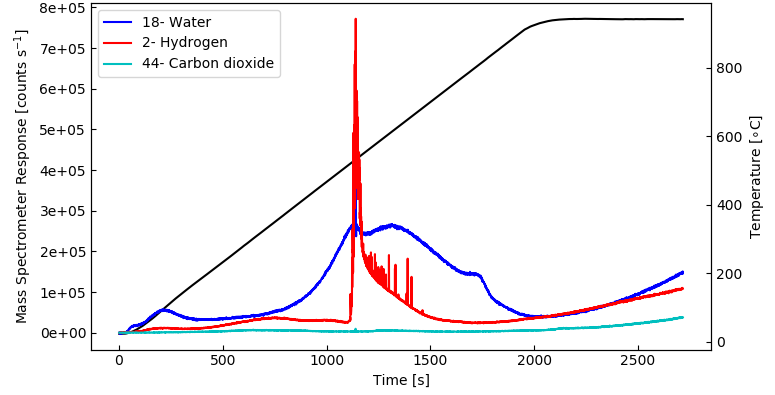
Image Credit: Hiden Analytical
As predicted, the MID scan results are in agreement with the spectra gathered from the 1 – 50 amu bar scan. The benefit of the MID scan is its quicker data acquisition, and so, higher resolution in time, i.e. temperature.
Noticeably, the data for hydrogen exhibited multiple spikes at temperatures over 500 °C which probably happen because of blistering of the sample surface giving rise to a sharp evolution of gas.
Surface Sample Comparison
The plot above shows data gathered from a similar Al2O3 coated Si sample generated at a different deposition temperature of the substrate in order to show the differences in these effusion measurements to other samples.
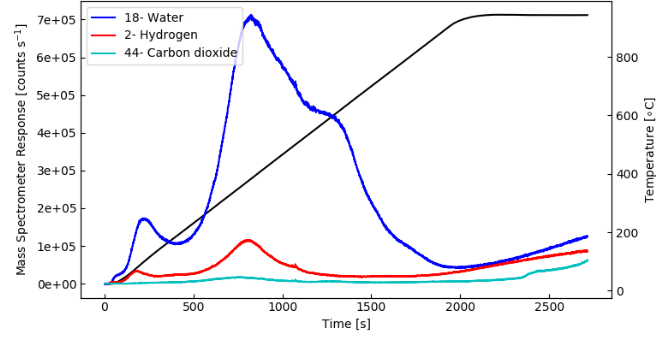
Image Credit: Hiden Analytical
In this case, almost no hydrogen desorption is observed but the carbon dioxide and water signal behave in a similar way to the first sample.
Conclusion
The Hiden TPD Workstation is perfect for assessing the microstructure of differently coated silicon surfaces and other thin film materials. Furthermore, any other gases can be simultaneously detected with the species of interest. The Hiden TPD Workstation is simple to use and provides high sensitivity and repeatability.
References
[1] phys. stat. sol. (c) 1, 5, 1144–1153 (2004)
[2] J. Appl. Phys. 111, 093713 (2012)
[3] J. Appl. Phys. 125, 105305 (2019)

This information has been sourced, reviewed and adapted from materials provided by Hiden Analytical.
For more information on this source, please visit Hiden Analytical.