Differential scanning calorimetry (DSC) is commonly employed in the evaluation of polymer materials’ physical properties; for example, their melting point, glass transition point, and thermal decomposition temperature.
When working with standard DSC measurements, however, the peaks and shifts could overlap in cases where multiple thermal phenomena occur in the same temperature range. This can lead to an analysis of the individual phenomena being challenging in some instances.
One alternative approach is the use of temperature-modulated DSC (TM-DSC) - a technique that enables the acquisition of information which cannot be obtained with standard DSC by temperature control, thanks to a modulation that is overlaid on a constant temperature increase.
In this article, the thermal characteristics of representative polymer materials were evaluated using the temperature modulation function of the Shimadzu DSC-60 Plus.
Separation of Heat Flows of Polyethylene Terephthalate
When employing TM-DSC, temperature control is performed by overlaying a small-amplitude modulation over a constant temperature increase (Figure 1). Figure 2 illustrates the type of data that can be acquired.
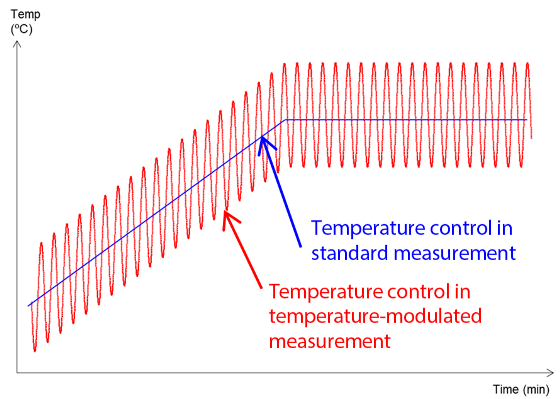
Figure 1. Temperature Control in TM-DSC.
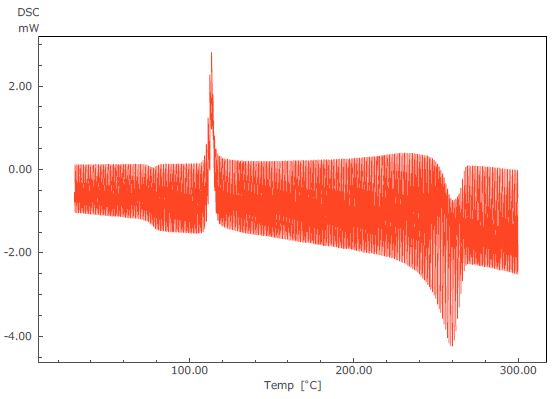
Figure 2. TM-DSC Curve of PET.
These results can be processed by using a temperature-modulated DSC analysis program from LabSolutions™. TA facilitates the acquisition of reversing heat flow, (which corresponds to changes in specific heat), and non-reversing heat flow (which corresponds to heat absorption and generation). This data is obtained in addition to the total heat flow provided by the standard DSC.
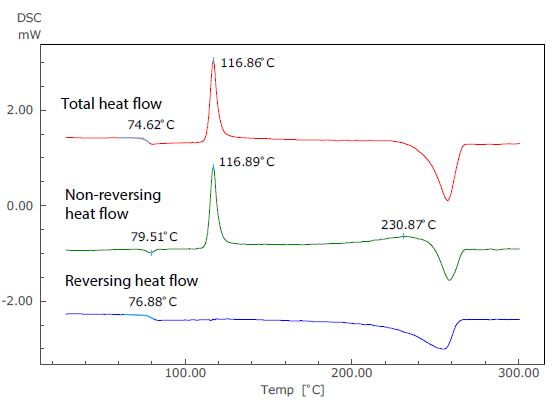
Figure 3. Analysis Results of TM-DSC Measurement of PET.
Figure 3 displays the results of an analysis of a TM-DSC measurement of polyethylene terephthalate (PET) - a common example whereby changes in specific heat and heat absorption and generation are seen to occur at the same temperature range. In this particular measurement, the heating rate was 2 °C/minute, the modulation amplitude was 0.2 °C and the modulation cycle was 40 seconds.
In the total heat flow (which corresponds to the standard DSC curve), the enthalpy relaxation and glass transition overlap at around 75 °C. In the TM-DSC measurements, however, the baseline shift resulting from the glass transition can be seen in the reversing heat flow, while the endothermic peak due to enthalpy relaxation can be seen in the non-reversing heat flow.
Using this approach, these two distinct phenomena can be identified separately using the temperature modulation technique.
The exothermic peak (the result of crystallization) that occurs near 117 °C can be seen only in the non-reversing heat flow, and an exothermic peak also occurs near 231 °C. Because of this, it can be assumed that recrystallization and melting are occurring simultaneously.
Melting Behavior of Nylon 6
A sample of nylon 6 was heat-treated at a cooling rate of -30 °C/minute after melting. A TM-DSC measurement was conducted at a heating rate of 2 °C/minute, modulation cycle of 80 seconds, and a modulation amplitude of 0.5 °C.
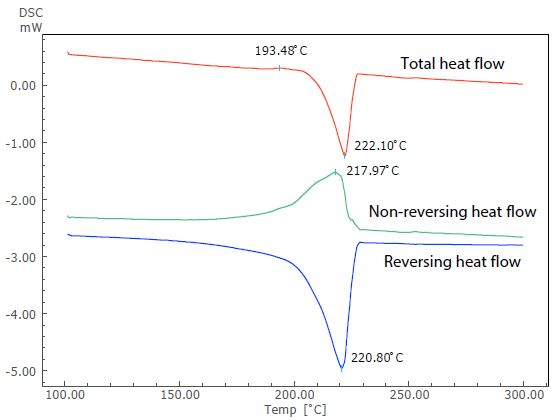
Figure 4. Analysis Result of TM-DSC Measurement of Nylon 6.
Figure 4 displays the results of this analysis. Nylon 6 is a crystalline polymer due to its thermodynamically metastable state. However, in this instance, an overlap of the exothermic peak (at around 193 °C) due to recrystallization can be seen before the endothermic peak due to melting, when the sample is heated at a slow heating rate.
The endothermic peak due to melting (close to 222 °C) in the total heat flow can be seen in the reversing heat flow, while the exothermic peak due to crystallization can be seen in the non-reversing heat flow. TM-DSC measurement allows the exothermic peak overlapping the endothermic peak to be separated.
Measurement of Epoxy Resin Adhesive
TM-DSC measurements were performed on epoxy resin-based adhesives that will harden as a function of time if two components are mixed. Figures 5 and 6 display measurement results for two samples where the curing time at room temperature has been altered to 4.5 hours and 42 hours, respectively.
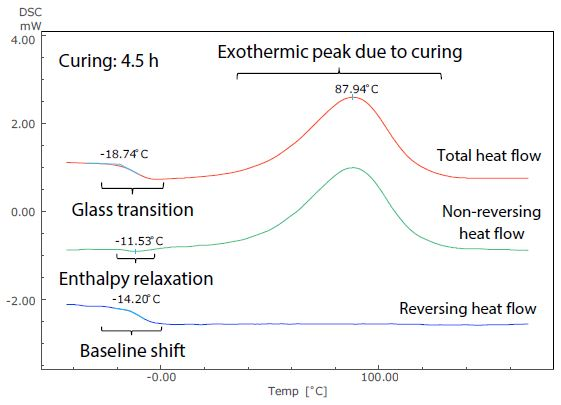
Figure 5. Analysis Results of TM-DSC Measurement of Epoxy Resin-Based Adhesive (Curing: 4.5 h).
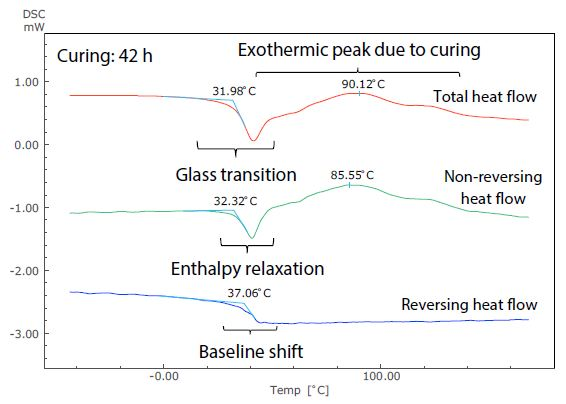
Figure 6. Analysis Results of TM-DSC Measurement of Epoxy Resin-Based Adhesive (Curing: 42 h).
These measurements were performed at a heating rate of 3.5 °C/minute, modulation cycle of 60 seconds, and modulation amplitude of 0.5 °C. By examining the total heat flow, the glass transition can be seen to occur near -19 °C in Figure 5. This shows the short (4.5 hours) curing time, but at around 32 °C in Figure 6, showing the long (42 hours) curing time.
The size of the exothermic peak resulting from curing also shrinks from Figure 5 to Figure 6. It is, therefore, possible to measure the shift of the glass transition to a higher temperature as curing continues, as well as the condition of the decrease in heat generation from curing by DSC (total heat flow).
Figure 6 shows that, conversely, the glass transition and the exothermic peak due to hardening are hard to identify in the total heat flow, because these occur in close proximity to one another.
These can be easily identified in the non-reversing and reversing heat flows, however, because the exothermic peak due to curing is separated to the non-reversing curve, while the baseline shift related to the glass transition is separate to the reversing curve.
Returning to the glass transition, while the endothermic peak resulting from enthalpy relaxation and the baseline shift resulting from the glass transition overlapped in the total heat flow in both Figures 5 and 6, these can be seen to be separated in the non-reversing data and reversing data. In Figure 5, enthalpy relaxation could have been overlooked in the standard DSC (total heat flow) because of its very subtle change.
In summary, when analyzing complex changes in sample data, such as reactions and transitions which occur simultaneously, temperature-modulated DSC enables the acquisition of information and knowledge which cannot be acquired using standard DSC alone.

This information has been sourced, reviewed and adapted from materials provided by Shimadzu Scientific Instruments.
For more information on this source, please visit Shimadzu Scientific Instruments.