Arrow™ is a ground-breaking consumable ATR solution that is ideal for a wide range of applications. Its potential uses are varied, ranging from testing chemically aggressive samples to the large scale batch testing of liquid samples or solids that have been dried from solution.
Arrow™ is comprised of a thin Si ATR element fitted inside a plastic slide, which is mounted on the Quest™ ATR unit. This design approach enables convenient handling and storage of slides without them coming into contact with the sample area. The slide itself is manufactured from 100 % recycled polypropylene.
This article explores the use of Arrow for the batch testing of samples from the food and drink industry.
Precise quantification of food and drink’s composition is vital if products are to be compliant with local and national regulations around the labeling of goods for general sale, as well as ensuring the correct application of customs duties when products are imported.
Labeling should include accurate information on the food or drink’s calorific and nutritional content, helping consumers to keep their intake within recommended limits.
Within this case study, solutions were prepared with water/ethanol in 26 different concentrations. A batch of Arrow™ slides was filled with aliquots from each solution before being covered with the Arrow™ sample cap to stop any potential evaporation. One slide was taken and held separately to be used as a background. Next, the prepared batch of slides was transferred to the spectrometer to be analyzed.
Spectra were acquired using a commercially available spectrometer. First, the background spectrum was recorded, then spectra were acquired in turn for each of the 26 Arrow™ sample slides.
The whole procedure was finished in under 10 minutes, due to there being no wipe down and cleaning required of the sampling point in between each individual spectral acquisition.
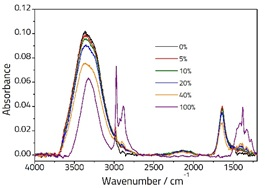
Figure 1 displays a selection of spectra for various concentrations of ethanol solution. The pure water spectrum (illustrated by the black line) shows characteristic peaks at ca. 3350 cm-1 (assigned to two overlapped peaks: symmetric, ν1, and antisymmetric, ν3 stretching vibrations) and ca.1640 cm-1 (assigned to the ν2 bending vibration).

Figure 1. Spectra showing various concentrations of Ethanol/Water solutions recorded on an ArrowTM ATR Slide.
The pure spectrum of ethanol (illustrated by the purple line) shows peaks that result from an OH stretching vibration at ca. 3330 cm-1, as well as CH stretching vibrations typical of an alkyl group between 3000-2800 cm-1 and additional peaks in the fingerprint region below 1500 cm-1.
The spectra of the mixture samples are comprised of a combination of the two pure samples, but some small changes can be seen due to interactions between them.
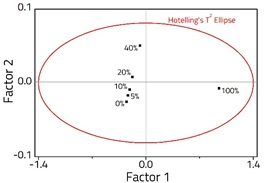
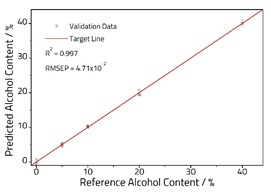
A 2-Factor PLS model was created from the spectra (Figure 2), accounting for 99.9 % of the variance within the dataset. The model was successfully validated using fresh samples (Figure 3), and a very good correlation was observed with an R2 = 0.997, and an RMSEP = 4.71 x 10⁻¹.

Figure 2. PLS Scores plot showing the sample distribution in 2 -factor space

Figure 3. Calibration plot comparing known and PLS predicted alcohol content.
The example shown here clearly demonstrates that Arrow™ can be successfully employed in the quantification of alcohol concentrations in a simple model system, utilizing PLS and identifying all relevant spectral bands.
For applications that necessitate bulk testing and spectral discrimination of more complex systems (for example contaminated or adulterated foodstuffs), Arrow’s convenient batch sample preparation and spectral acquisition speed come into their own.

This information has been sourced, reviewed and adapted from materials provided by Specac Ltd.
For more information on this source, please visit Specac Ltd.