While a large number of resin and metal materials demonstrate plastic deformation behavior, ceramic and glass materials exhibit almost no plastic deformation. Rather, they are prone to brittle failure. When acquiring the material strength of brittle materials using short-time and high-speed measurement, the resulting strength value and any data scatter could vary depending on the testing machine’s sampling speed.
This experiment aims to evaluate the effect of sampling speed on measured strength values. It determines this through the performance of strength tests on resin and ceramic samples, using data processing to adjust sampling speed after the test.
Tensile Test of Resin
An Autograph AGX™-10 kNV precision universal testing machine (from Shimadzu Corporation) was used to perform a tensile test on an acrylic resin. Testing was undertaken at the instrument’s maximum speed of 3000 mm/min. Sampling speed was set to 10000 Hz.
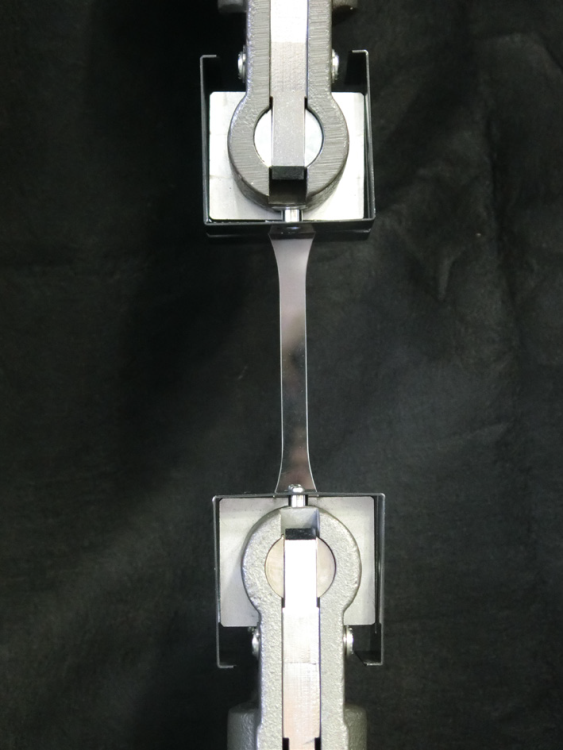
Table 1 and Table 2 show additional information on specific test conditions and the specimen respectively, while Figure 1 displays a picture of the test itself. Once the test had been completed, data thinning processing was used to acquire data corresponding to four sampling speeds (5000 Hz, 1000 Hz, 100 Hz, 20 Hz).
Table 1. Test Conditions. Source: Shimadzu Scientific Instruments
| . |
. |
. |
| Instrument |
: |
AGX-V precision universal testing machine |
| Load cell |
: |
10 kN |
| Test jig |
: |
5 kN pneumatic flat grip |
| Grip teeth |
: |
Single file teeth grip face |
| Initial distance between grips |
: |
115 mm |
| Software |
: |
TRAPEZIUM™ X-V Single |
| Test speed |
: |
3,000 mm/min |
| Sampling speed (Hz) |
: |
10,000, 5,000, 1,000, 100, 20 |
Table 2. Specimen Details. Source: Shimadzu Scientific Instruments
| . |
. |
. |
| Resin |
: |
Acryl |
| Dimensions of narrow portion |
: |
Width 10 mm × thickness 4 mm
(ISO 527 dumb-bell-shaped type 1A) |

Figure 1. Tensile Test of the Resin Specimen. Image Credit: Shimadzu Scientific Instruments
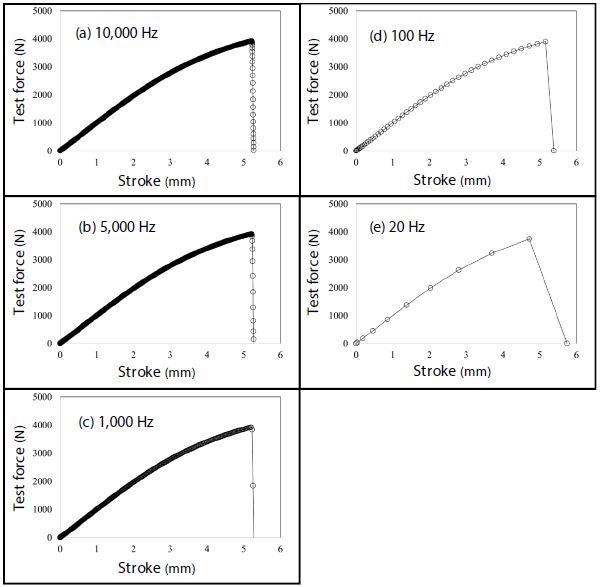
Figure 2(a) displays results from measurements taken at 10000 Hz, while Figures 2(b) to 2(e) include results for each of the sampling speeds after the data thinning post process had been completed. Because this experiment used a short measurement time (approximately 0.5s), a notable discrepancy was observed in the force peak value between data that was obtained at 20 Hz and data that was obtained at 100 Hz.

Figure 2. Test Results. Image Credit: Shimadzu Scientific Instruments
Table 3 provides details on tensile strength at each individual sampling speed, alongside the strength decrease ratio compared to the strength at 10000 Hz - set at the standard value.
Table 3. Test Results Sorted by Sampling Speed (Average Value, Number of Tested Samples: 5). Source: Shimadzu Scientific Instruments
| Sampling speed (Hz) |
Tensile strength (MPa) |
Strength decrease ratio* (%) |
| 10000 |
96.30 |
- |
| 5000 |
96.30 |
0 |
| 1000 |
96.24 |
0.06 |
| 100 |
95.44 |
0.89 |
| 20 |
92.69 |
3.75 |
* Ratio of strength decrease to strength at 10,000 Hz as standard.
The decrease in strength from 10000 Hz is on the order of 1% at 100 Hz and 4% at 20 Hz. This is the result of an inaccurate peak value detection. Because of this inaccuracy, a minimum sampling speed of 1000 Hz is required if the high-speed tensile strength of acrylic resin is to be correctly evaluated.
Compression Test of Ceramic
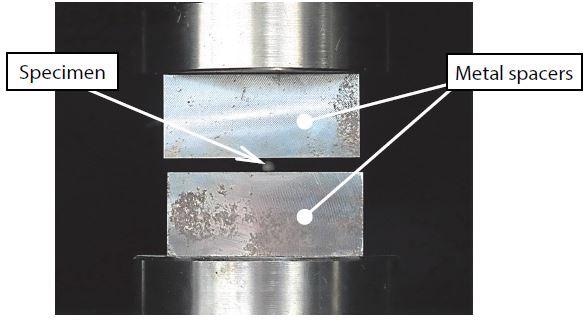
An Autograph AGX™-100 kNV precision universal testing machine (from Shimadzu Corporation) was used to perform a compression test of an alumina sample. In order to protect the compression plates, metal spacers were used during this test. Test speed was set to the maximum value of 1500 mm/min while sampling speed was set at 10000 Hz.
Table 4 and Table 5 display additional information on specific test conditions and the specimen respectively, while Figure 3 includes an image of the test itself. Following the test, data thinning processing was, once again, used to generate data corresponding to four different sampling speeds (5000 Hz, 1000 Hz, 100 Hz, 20 Hz).
Table 4. Test Conditions. Source: Shimadzu Scientific Instruments
| . |
. |
. |
| Instrument |
: |
AGX-V precision universal testing machine |
| Load cell |
: |
100 kN |
| Test jig |
: |
Fixed compression plates φ100 mm
Metal spacers
Length 70 mm × width 65 mm × thickness 30 mm |
| Software |
: |
TRAPEZIUM X-V Single |
| Test speed |
: |
1,500 mm/min |
| Sampling speed (Hz) |
: |
10,000, 5,000, 1,000, 100, 20 |
Table 5. Specimen Details. Source: Shimadzu Scientific Instruments
| . |
. |
. |
| Ceramic |
: |
Alumina |
| Dimensions |
: |
φ5 mm sphere |

Figure 3. Compression Test. Image Credit: Shimadzu Scientific Instruments
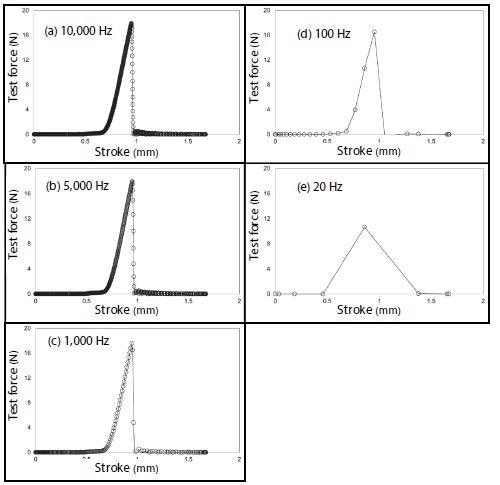
Figure 4(a) displays results acquired at 10000 Hz, while Figures 4(b) to 4(e) show results at each of the different sampling speeds processed. The utilization of shorter measurement time when compared to that of the tensile test of resin (0.04 s) led to a considerable discrepancy in the force peak value at a sampling speed of 1000 Hz.

Figure 4. Test Results. Image Credit: Shimadzu Scientific Instruments
Table 6 displays compressive strength and standard deviation at each of the four sampling speeds, along with the strength decrease ratio in comparison with the 10000 Hz standard value. Data shown in Table 6 suggests that lower sampling speeds result in higher standard deviation and increased data scatter.
Table 6. Test Results Sorted by Sampling Speed (Average Value, Number of Tested Samples: 5). Source: Shimadzu Scientific Instruments
Sampling
speed (Hz) |
Compressive
strength (kN) |
Standard
deviation (kN) |
Strength
decrease ratio* (%) |
| 10000 |
18.87 |
0.86 |
- |
| 5000 |
18.86 |
0.87 |
0.03 |
| 1000 |
18.60 |
0.91 |
1.40 |
| 100 |
15.32 |
3.15 |
18.8 |
| 20 |
10.79 |
3.70 |
42.8 |
* Percentage of strength decrease from strength at 10,000 Hz as standard.
It should also be noted that the material strength values acquired for the sampling speeds of 1000 Hz, 100 Hz and 20 Hz were all calculated with an error higher than 1% when compared with the strength standard value at 10000 Hz. It can be concluded that this test requires a sampling speed of 5000 Hz or higher in order to accurately evaluate material strength.
Conclusion
This experiment was high speed strength tests performed on ceramic and materials, with relationships measured between sampling speeds and measured strength values.
The results illustrate that sampling speed is key for accurate evaluation of strength when performing high speed test characterized by a short measurement time on brittle materials.
The Shimadzu AGX-V easily meets this requirement and is able to correctly detect force peak and thus, material strength. The instrument comfortably facilitates high speed tests as well as high sampling speeds up to a maximum of 10000 Hz.

This information has been sourced, reviewed and adapted from materials provided by Shimadzu Scientific Instruments.
For more information on this source, please visit Shimadzu Scientific Instruments.