Polyurethane is a common polymer which can sometimes be challenging to analyze. Polyurethanes are utilized particularly in rigid and flexible foams, elastomers and resins. Their performance characteristics are highly dependent on their molecular weight properties.
Usually, polyurethanes are analyzed by utilizing gel-permeation chromatography (GPC, or size-exclusion chromatography, SEC) with extensive column calibration and polymer standards.
In addition to being tedious, column calibration means that the resulting answers will not be absolute, only relative. Results will be reliant on the assumption that the reference standards have the same density, conformation, and column interactions as the analyte of interest.
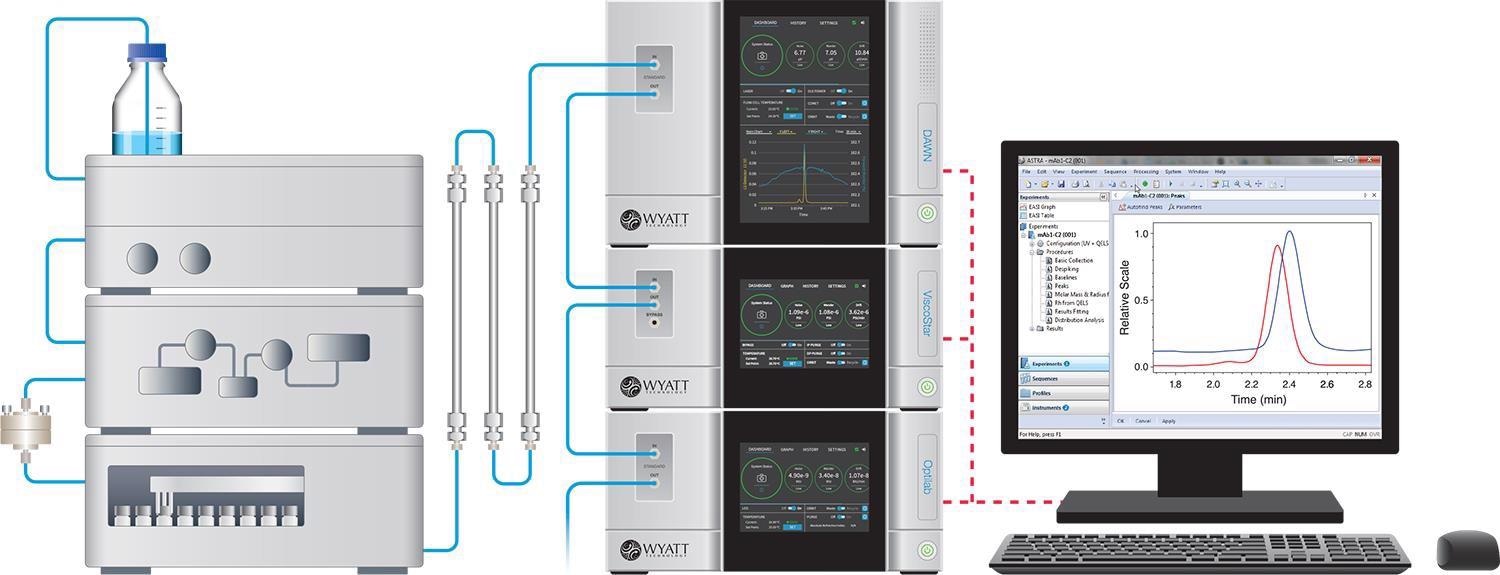
A much more effective means of characterizing polyurethanes involves creating a SEC-MALS system which eliminates the need for column calibration and reference standards by adding multi-angle light scattering (MALS) to SEC.1 SEC-MALS analysis derive from first principles; they do not depend on such assumption and are absolute.
Materials and Methods
A polyurethane sample was dissolved with 0.01 M LiBr in DMF. By injecting aliquots at a series of carefully prepared concentrations into an Optilab differential refractometer the specific refractive index increment, dn/dc, was measured off-line.
In order for the measured dn/dc value to supply the maximal accuracy in concentration and MALS analyses, the Optilab utilizes a light source at the same wavelength as the DAWN multi-angle light scattering detector.
Next, an aliquot was injected onto the SEC column at a flow rate of 0.485 mL/min. In order to establish the molar mass of each one-second slice, the eluting fractions were characterized by the DAWN and Optilab.
Results and Discussion
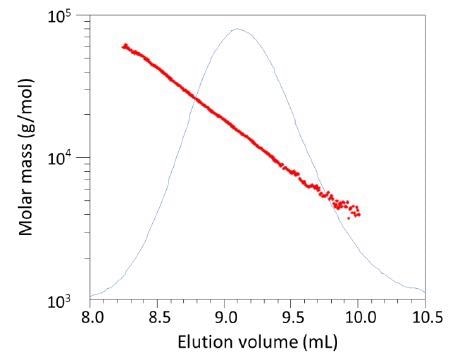
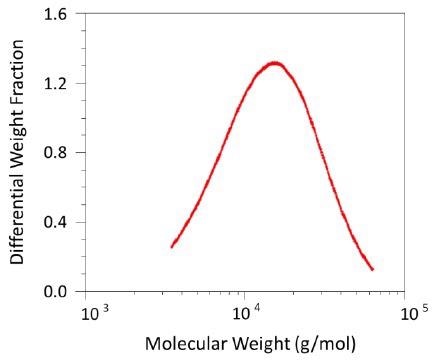
The results below demonstrate the absolute molar mass at each slice in the light scattering chromatogram (Figure 1) and the conversion to a differential distribution (Figure 2) and are courtesy of Kolon Corp., Korea.

Figure 1. A plot of the molecular weight vs. volume for the polyure-thane sample overlaid upon the trace from the 90° light-scattering detector. Image Credit: Wyatt Technology

Figure 2. The differential molecular weight distribution of this polyu-rethane ranges from about 4 kDa to more than 60 kDa. Image Credit: Wyatt Technology
The logarithmic molar mass-elution volume relationship displayed gives a clear indication that no unexpected column interactions happen and the separation is ideal. The results are analyzed further to produce the absolute weight-average molar mass Mw, other molecular weight moments of the peak and the polydispersity Mw/Mn. These are displayed in Table 1 as are the uncertainties of each of the calculated quantities.
Table 1. Molar mass and polydispersity results from SEC-MALS. Source: Wyatt Technology
| Property |
Value |
| Peak range |
8.25 - 10.00 mL |
| Injected mass |
2.058 x 10⁻⁴ g |
| Mn - number-average MW |
(1.36±0.03) x 104 g |
| Mw – weight-average MW |
(2.02±0.02) x 104 g |
| Mz – z-average MW |
(2.87±0.05) x 104 g |
| Polydispersity Mw/Mn |
1.49±0.04 |
Conclusions
While standard GPC is thought to be the primary method for establishing molar mass distributions, only SEC-MALS supplies unbiased and absolute molar mass measurements. Adding a MALS instrument to an existing GPC system brings new levels to absolute polymer characterization.

Image Credit: Wyatt Technology
Reference
- Wyatt, P. J. Light scattering and the absolute characterization of macromolecules. Anal. Chim. Acta 272, (1993).

This information has been sourced, reviewed and adapted from materials provided by Wyatt Technology.
For more information on this source, please visit Wyatt Technology.