Complex technical products such as airplanes, cars and bicycles will often contain smaller, less complex technical parts including bicycle frames or engines and gears, to guarantee their functionality. These smaller technical components again contain smaller, basic parts such as housings, gear wheels, screws, wires, and so on.
In the end, every single component can be traced back to the raw materials, which include pure metals or alloys such as copper, steel, titanium, or to synthetic organic products, which are also based on natural products like oil, gas or coal.
Besides the diversity of material compositions available for assembling complex technical products, the applied production technology is of particular interest. Traditional technical production methods include drilling, founding or welding, and several more. Additional descriptions and definitions of production methods are detailed in the German DIN 8580 standard.
When building a large, complex machine such as an airplane, more manufacturing steps are required. A fairly recent production method such as additive manufacturing (AM) can help overcome some of the drawbacks found in traditional production techniques, such as founding or welding, because complex structures can be generated in just a single step.
The DIN EN ISO/ASTM 52900:2018 standard (Additive manufacturing- General principles) describes additive manufacturing as a common term that denotes the technologies that produce physical objects by sequential addition of material, based on a geometrical representation.
An AM machine that has the capacity to build the requested product is essential for this process. Meanwhile, AM products can be found across a variety of industries, including food, fashion and transportation.
Although the additive manufacturing method is completely different from traditional methods like founding or drilling, there is one key detail that they have in common: regardless of the use, size and geometry either of an AM or a traditionally manufactured product, a raw material with specific specifications is always used in production.
Traditional production methods usually require raw materials like solid steel or cast iron which are typically shaped as sheets, bars, tubes or wires.
Founding involves a liquid raw material that could be based on aluminum or any other alloy. AM raw materials are generally solid powders and are known as feedstock (chapter 3.6.6 of ASTM 52900).
Feedstock can be based on aluminum, cobalt, copper, iron, nickel, titanium, precious metals or customized mixtures. Independent of its shape, the chemical composition of the raw material will influence the mechanical properties of the final product.
The content of non-metals, such as carbon, sulfur or gases like oxygen, nitrogen and hydrogen, may impact the eventual brittleness, hardness and ductility of the end product.
Traditional production methods refer to well-established standards such as the ASTM E 1019 for good quality control of the raw material, while quality control of feedstock is a fairly recent development which can be challenging due to the powder shape and a wide range of chemical compositions.
The recent DIN EN ISO /ASTM 52907 from 2020 (Additive manufacturing- Feedstock materials methods to characterize metal powders) outlines the following technical parameters needed to characterize the quality of metal powder:
- Particle size distribution
- Chemical composition
- Characteristic densities
- Morphology
- Flowability
- Contamination
- (Packing, handling, storage)
This article focuses on the chemical analysis of metal powders, specifically the measurement of oxygen, nitrogen, hydrogen as well as carbon and sulfur while detailing the current status of elemental analysis.
Carbon / Sulfur Analyzer ELEMENTRAC CS-i - Introduction - ELTRA
Figure 1. Product Video ELEMENTRAC CS-i analyzer. Video Credit: ELTRA GmbH
Chemical Composition
The typical chemical characterization of metal powders comprises the identification of various metal elements like Mn, Fe and Cu, which may be present as a major or minor part, or even in traces. It also includes the determination of nonmetals and gases like carbon, sulfur, oxygen, nitrogen and hydrogen. For safe and reliable measurements of metals, nonmetals and gases, different analytical techniques are applied.
The ASTM 52907 standard stipulates spectrometric methods such as AAS, X-Ray fluorescence analysis for the first group, and combustion and fusion techniques for the second group.
Generally speaking, spectrometric techniques offer a reliable analysis of the metal parts, whereas combustion and fusion techniques provide a wide determination range of carbon, sulfur, oxygen, nitrogen and hydrogen.
The ASTM 52907 standard refers to other established standards (table 1) for C/S and O/N/H analysis without additional special recommendations for powder analysis.
Table 1. Recommend standards for C/S and O/N/H analysis (ASTM 52907). Source: ELTRA GmbH
| Matrix |
Carbon |
Sulphur |
Oxygen |
Nitrogen |
Hydrogen |
| Steel and Iron |
ISO 9556, or
ISO 15349-2 or
ISO 15350 or
ASTM E1019 |
ISO 13902 or
ISO 15350 or
ASTM E1019 |
ISO 17053 or
ASTM E1019 |
ISO 10720 and
ISO 15351 or
ASTM E1019 |
NN |
| Titanium and titanium alloys |
ASTM E1941 |
NN |
ISO 22963 or
ASTM E1409 |
ASTM E1409 |
ASTM E1447 |
| Nickel and nickel alloys |
ISO 7524 or
ASTM E1019 |
ISO 7526 or
ASTM E1019 |
ASTM E1019 |
ASTM E1019 |
NN |
| Aluminium and aluminium alloys |
NN |
NN |
NN |
NN |
ASTM E2792 |
| Cobalt alloys |
ISO 11873 or
ASTM E1019 |
ISO 11873 or
ASTM E1019 |
ASTM E1019 |
ASTM E1019 |
NN |
| Copper and copper alloys |
NN |
ISO 7266 |
ASTM E2575 |
NN |
NN |
To cover the entire range of C/S and O/N/H analyses, two different types of elemental analyzers are required, both of which are detailed in the ASTM E 1019 or E 1447. Combustion analyzers vary with regards to the integrated furnace type (induction or electrode), the applied carrier gas and the sample carrier (crucible) used.
The common principle is the melting of the sample in a gas stream and measurement of the released gases in infrared (IR) or thermal conductivity cells (TCD). Table 2 shows some fundamental features of a C/S and O/N/H combustion analyzer.
Table 2. Technical features of combustion analyzers. Source: ELTRA GmbH
| Elements |
Technique |
Carrier gas |
Sample carrier |
Sample weight (mg) |
Suitable analyzer (ELTRA) |
| C/S |
Combustion with induction furnace |
Oxygen |
Ceramic crucible |
50-1000 |
ELEMENTARC CS-i (Fig.1) |
| O/N/H |
Inert gas fusion via electrode (impulse) furnace |
Helium / Nitrogen / (Argon) |
Graphite crucible |
50-3000 |
ELEMENTRAC ONH-p 2 (Fig. 2) |
As previously mentioned, the ASTM 52907 standard refers to the established standards for C/S and O/N/H measurement without offering advice or hints for the appropriate processing of feedstock samples. This may lead to conflicts, as the well-established standards for elemental analysis (table 1) mainly focus on the analysis of solid samples or drillings.
This conflict is generally related to the sample preparation process rather than the technical specifications of the elemental analyzer (see table 3).
Table 3. Requirements for sample preparation according to selected standards (March 2021). Source: ELTRA GmbH
| Standard |
Carbon & sulfur
measurement |
Oxygen
measurement |
Nitrogen
measurement |
| ASTM E 1019-18 |
Particle size >=0.422 mm (40 mesh) |
Use only solid specimens (Caution: surface oxidation!) |
Refers to ASTM E 1806 (describes preparation of chips, drillings, slugs, solids) - No powders- |
| ISO 170 53 |
NN |
Refers to ISO 14284 (preparation of pins for oxygen measurement) |
NN |
| ISO 15350 |
Refers to ISO 14284 (various techniques for C/S analysis: Usually preparation of drillings) |
NN |
NN |
| ASTM E 1409 |
NN |
Describes only solid pieces and required surface treatment |
Table 3 shows that the correct C/S and O/N/H analysis of feedstock can be a challenge due to the inconsistent requirements of the different standards. Detailed steps of the measuring process, typical analyzers, settings and sample preparation are explained below.
This article presents analysis data of various powders measured with ELTRA’s ELEMENTRAC ONH-p2 and CS-i analyzers, including the settings applied and sample preparation process. This data shows that the analysis of feedstock samples is safe, reliable and straightforward, as long as certain aspects are taken into account.
The ELEMENTRAC ONH-p2 Analyzer
The powerful ELEMENTRAC ONH-p2 is an inert gas fusion analyzer that uses an 8.5 kW electrode furnace, two infrared cells and a wide range thermal conductivity cell for the reliable and safe analysis of oxygen, nitrogen and hydrogen. For trained and untrained users alike, performing an analysis is conveniently straightforward and safe.
Oxygen, nitrogen and hydrogen analyser ONH-p 2 - Short introduction - ELTRA
Figure 2. Product Video ELEMENTRAC ONH-p2. Video Credit: ELTRA GmbH
The sample is logged in the ELEMENTS software with its weight, followed by the application to the sample port and starting the measurement in the software. All subsequent steps are done automatically.
Once software analysis begins, the sample port closes and the sample is flushed with a carrier gas, which stops atmospheric gas (oxygen and nitrogen) from entering the furnace.
Meanwhile, the outgassing of a graphite crucible is performed in the impulse furnace of the analyzer to eliminate potential contaminations. After a short stabilization phase, the sample is placed into the crucible and melts.
A sealing of capsules (which contain the powder) is not necessary due to the vertical sample transfer to the crucible (fig. 3) in combination with the effective flushing. This streamlines the whole analysis process of feedstock and any other powdered samples.
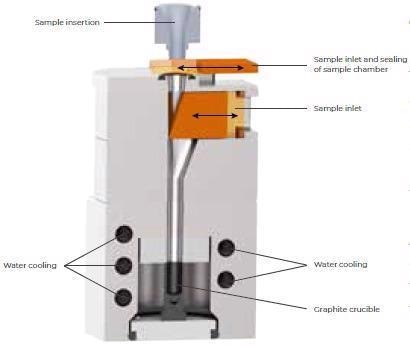
Figure 3. Sample port and furnace of the ELEMENTRAC ONH-p2. Image Credit: ELTRA GmbH
In the following, carbon monoxide is produced by the reaction of carbon in the graphite crucible and oxygen of the sample. Nitrogen and hydrogen are produced in elemental form. The carrier gas (helium) and sample gasses pass through a filter before crossing a copper oxide catalyst which converts the CO to CO2. The CO2 is measured by the infrared cells to establish the oxygen content. CO2 and water are chemically eliminated, and the nitrogen content is measured in the thermal conductivity cell.
In the case of hydrogen analysis, both the nitrogen carrier and sample gas pass through a Schuetze reagent rather than a copper oxide catalyst. The less expensive Argon can be used as an option to measure the oxygen and nitrogen content throughout the analysis.
The ELEMENTRAC CS-i Analyzer
The elemental analyzer ELEMENTRAC CS-i measures the carbon and sulfur concentration in mostly inorganic samples by means of combustion in an induction furnace and subsequent analysis of the gaseous combustion products carbon dioxide and sulfur dioxide in up to 4 infrared cells.
The high temperature – in excess of 2000 °C – guarantees total decomposition of the sample and, therefore, ensures reliable and accurate elemental analysis across a wide concentration range.
An accelerator like tungsten (approx. 1.7 g) must be added (fig.4) after weighing a feedstock sample in a ceramic crucible and logging the sample in the ELEMENTS software.
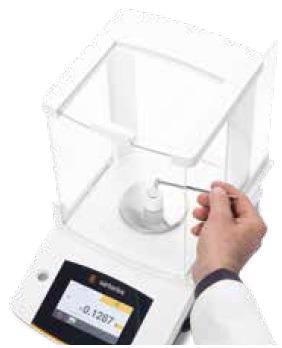
Figure 4. Applying accelerator to a weighed sample. Image Credit: ELTRA GmbH
After positioning the sample on the pedestal (fig. 5) and initiating the analysis, all following steps are automatically processed. In the induction furnace of the elemental analyzer, the sample and accelerator are melted in a pure oxygen atmosphere, causing sulfur to react to sulfur dioxide (SO2) and carbon to a mixture of carbon monoxide (CO) and carbon dioxide (CO2).
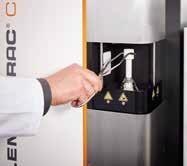
Figure 5. Placing sample with accelerator on the pedestal of the ELEMENTRAC CS-i. Image Credit: ELTRA GmbH
For purification, the combustion gases pass a dust filter and moisture absorber. In the subsequent step, sulfur dioxide is found in infrared cells. In the CS-i, infrared cells with varying sensitivities (high/low) can be modified in line with the user’s requirements.
Oxidation of both carbon monoxide to carbon dioxide and sulfur dioxide to sulfur trioxide follow the sulfur measurement. The SO3 gas is then eliminated using cellulose wool, and the carbon content is detected by infrared cells.
Sample-Related Settings and Preparation for ONH Analysis
For each metal powder, an individual application has to be developed first which considers the sample amount available, the chemical nature of the sample, as well as the particle shape and size.
These specifications determine the maximum appropriate amount of sample for a single analysis, the sample preparation required and, of course, the analysis power used in the application. The following diagram shows the general procedure:
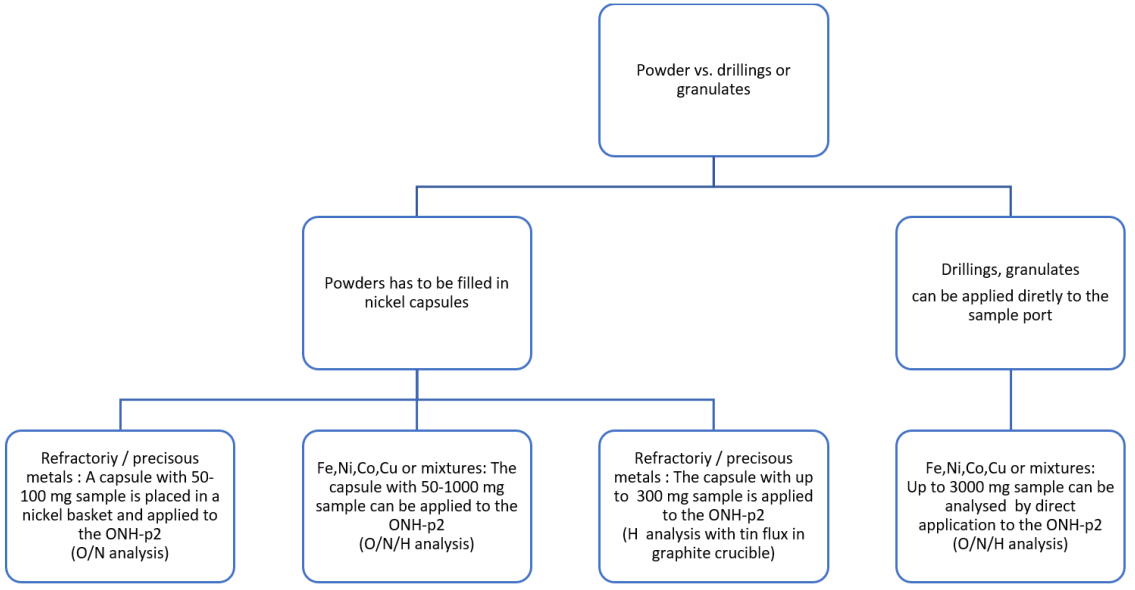
Image Credit: ELTRA GmbH
Generally, samples for additive manufacturing are fine powders (fig. 6). These samples always require a nickel capsule prior to being applied to an elemental analyzer. Without it, they could cause blockages, meaning the complete transfer to the graphite crucible would be unsafe.
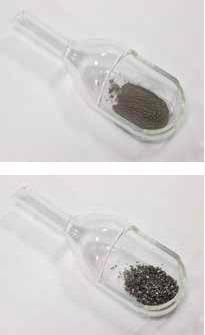
Figure 6. (above) Fine powder needs to be placed in a capsule before analysis in the ONH-p2. (below) Granulate / drilling (ironbased) can be analyzed without capsule. Image Credit: ELTRA GmbH
Depending on the chemical nature of the powder, additional sample preparation steps are necessary for a valid oxygen and nitrogen analysis.
Refractories and precious metals like titanium, palladium and platinum have a high melting point. To guarantee a complete release of the embedded gases, extra flux needs to be provided. To reduce the melting point of the resulting alloy in the crucible, the nickel capsule with the high-melting sample is inserted into an additional nickel basket.
For analysis to be reliable, the sample amount is generally restricted to 50-100 mg for oxygen and nitrogen measurement (fig. 7). Since hydrogen is released much easier from the sample in case of hydrogen analysis, the sample amount can be increased, and a nickel basket is not required.

Figure 7. Application of a nickel basket (flux for precious metals and refractories). Here without the nickel capsule and sample. Image Credit: ELTRA GmbH
ELTRA advises that you apply tin flux to the graphite crucible to ensure a smooth release of the embedded hydrogen.
Sample-Related Settings and Preparation for CS Analysis
For a reliable CS measurement, fewer parameters must be considered compared to an ONH measurement. In general, the particle size distribution is negligible, but because of the intensive combustion, the potential to lose sample material due to swirling has to be taken into account. With typical sample weights of 250-500 mg, the sample is completely covered with an accelerator, and swirling is negligible.
For greater sample weights, the ELEMENTRAC CS-i offers special solutions like induction power control and intelligent oxygen supply to guarantee smooth and complete combustion that is free of sample dust caused by swirling or sputtering.
Depending on the base of the feedstock, various accelerators have to be added to ensure total oxidation of the embedded carbon and sulfur. The table below summarizes conventional sample weights and recommended accelerators:
Table 4. Source: ELTRA GmbH
Feedstock
base |
Recommended sample
weight for analysis (mg) |
Recommended
accelerator |
Iron, nickel,
cobalt |
250-1000 mg |
Tungsten (1.7 g) |
| Copper |
1000 mg |
Copper (2 g) alternatively:
Copper (1 g) + Iron (0.7 g) |
Refractories;
precious metals |
Up to 250 mg |
Tungsten/tin (2 g) ;
alternatively tungsten (1.7 g)/iron (0.7 g) |
Copper is printed in italic letters as the analysis of copper-based or copper-containing samples can be critical regarding precise and reliable sulfur analysis in general. Intensive combustion could result in too low sulfur determination induced by the forming of copper sulfide (ASTM E1941-10; Note 7).
A technical solution for this situation is implemented in the ELEMENTRAC CS-i. A reliable sulfur analysis in copper or even copper concentrates can be attributed to the intelligent oxygen supply and ramping feature, which facilitates smooth combustion without a form of copper sulfide. For more information, request the ELTRA application notes 1037 and 1066
Application Examples
In the following, standard analysis data for various sample shapes with different bases are displayed. The data provided is based on both the analysis of customer samples and the analysis of certified reference materials.
a) Analysis of Steel Granulates (CRM)
Table 5. Source: ELTRA GmbH
| . |
. |
| Analysis |
Oxygen and nitrogen with ELEMENTRAC ONH-p 2 |
| Sample |
EZRM 284-2 |
| Sample preparation |
None. Direct application to the furnace (see picture 8) |
| Settings |
Standard steel analysis with 4500 W; 2,5 -3 min. cycle time per sample |

Figure 8. Direct application of steel granulate. Image Credit: ELTRA GmbH
Table 6. Source: ELTRA GmbH
| Typical results |
Steel granulate
ZRM 284-2* |
|
| Weight (mg) |
Oxygen (ppm) |
Nitrogen (ppm) |
| 1018 |
99.7 |
148.8 |
| 1057 |
96.5 |
152.6 |
| 1036 |
99.3 |
150.3 |
| 1027 |
99.1 |
150.6 |
| 1015 |
97.7 |
151.5 |
| 1021 |
102.0 |
150.1 |
| 1020 |
98.4 |
153.4 |
| 1035 |
99.2 |
150.0 |
| 1029 |
99.8 |
149.0 |
| 1011 |
98.1 |
153.4 |
| Mean value |
| |
99.0 |
151.0 |
| Deviation / Relative deviation (%) |
| |
1.5 (1.5) |
1.7 (1.1) |
* Certified value: O 99 +- 7 ppm; N 151 +- 2 ppm
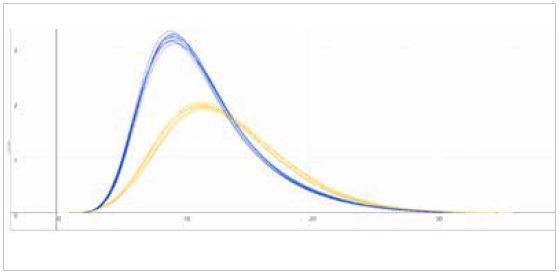
| Measuring graph |
|
| blue peak: oxygen signal |
yellow peak: nitrogen signal |
| x-axis: time (sec) |
y-axis: intensity (voltage) |
Image Credit: ELTRA GmbH
Table 7. Source: ELTRA GmbH
| . |
. |
| Analysis |
Carbon and sulfur with ELEMENTRAC CS-i |
| Sample |
JSS003-8 |
| Sample preparation |
None |
| Settings |
Accelerator 1.7 g tungsten
Cycle time: 90 seconds/ analysis |
The analysis data may not be representative of a typical feedstock sample, but it shows that even very low carbon and sulfur concentrations can be reliably measured with precision.
Table 8. Source: ELTRA GmbH
| Typical results |
| JSS 003-8 *1 |
| Weight (mg) |
Carbon (ppm) |
Sulfur (ppm) |
| 1093 |
3.9 |
1.5 |
| 1069 |
4.4 |
1.8 |
| 1026 |
4.0 |
1.8 |
| 1002 |
4.3 |
1.7 |
| 1095 |
3.5 |
1.5 |
| 1034 |
4.0 |
1.4 |
| 1082 |
4.2 |
1.5 |
| 1007 |
4.2 |
1.5 |
| 1093 |
3.9 |
1.6 |
| 1044 |
4.0 |
1.5 |
| Average values |
| |
4.1 |
1.6 |
| Deviation / Relative deviation (%) |
| |
0.26 (6.3%) |
0.1 (9.4%) |
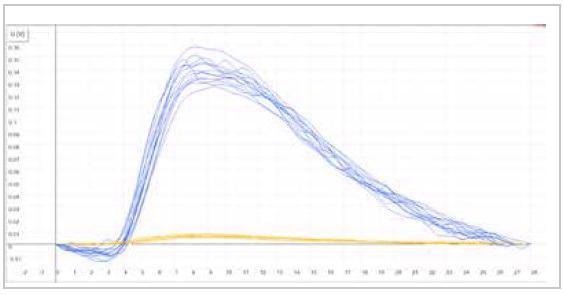
| Measuring graph |
|
| blue peak: carbon signal |
yellow peak: sulfur signal |
| x-axis: time (sec) |
y-axis: intensity (voltage) |
Image Credit: ELTRA GmbH
b) Analysis of Nickel Feedstock
Table 9. Source: ELTRA GmbH
| . |
. |
| Analysis |
Oxygen and nitrogen with ELEMENTRAC ONH-p 2 |
| Sample |
Nickel powder from ASTM Cycle AMPM 2010 |
| Sample preparation |
Sample filled in nickel capsule (see picture 9) |
| Settings |
Standard steel analysis with 4500 W; 2,5 -3 min. cycle time per sample |
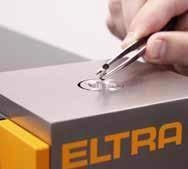
Figure 9. Application of open capsule with powder. Image Credit: ELTRA GmbH
Table 10. Source: ELTRA GmbH
| Typical results |
Nickel powder
ASTM AMPM 2010 |
|
| Weight (mg) |
Oxygen (ppm) |
Nitrogen (ppm) |
| 260 |
198 |
108 |
| 250 |
199 |
111 |
| 225 |
202 |
105 |
| 243 |
199 |
108 |
| 227 |
203 |
108 |
| 287 |
202 |
106 |
| 233 |
203 |
107 |
| 291 |
203 |
105 |
| 270 |
202 |
109 |
| 255 |
199 |
108 |
| Mean value |
| |
201 |
107 |
| Deviation / Relative deviation (%) |
| |
2.0 (1.0) |
1.7 (1.6) |
* Certified value: not available
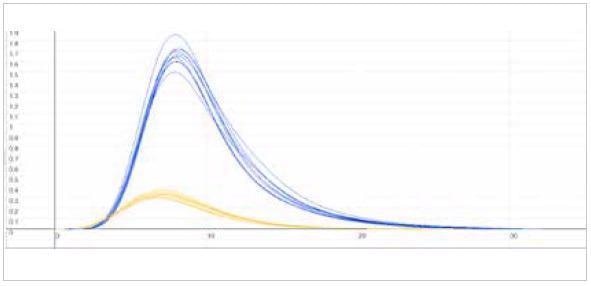
| Measuring graph |
|
| blue peak: oxygen signal |
yellow peak: nitrogen signal |
| x-axis: time (sec) |
y-axis: intensity (voltage) |
Image Credit: ELTRA GmbH
The oxygen content measured is informative and was not included in the ASTM cycle. As a result of the fine particle size of the powder oxidizing, a surface oxidizing during storage time may be possible.
Table 11. Source: ELTRA GmbH
| . |
. |
| Nickel powder ASTM AMPM 20210: measurement after 12 weeks storage in a sealed, brown glass bottle (150 ml) |
| Oxygen (N=4) |
199 +- 1,2 ppm |
| Nitrogen (N=4) |
109 +- 2 ppm |
For an initial evaluation of a possible oxidation effect, the measurement was repeated after 12 weeks. For O/N analysis, another aliquot was utilized, which was stored for 12 weeks inside a 150 ml brown glass bottle.
Table 12. Source: ELTRA GmbH
| . |
. |
| Analysis |
Oxygen and nitrogen with ELEMENTRAC ONH-p 2 |
| Sample |
Nickel powder from ASTM Cycle AMPM 2010 |
| Sample preparation |
None |
| Settings |
Accelerator 1.7 g tungsten
Cycle time: 90 seconds/ analysis |
Table 13. Source: ELTRA GmbH
| Typical results |
Nickel powder
ASTM AMPM 2010 |
| Weight (mg) |
Carbon (ppm) |
Sulfur (ppm) |
| 499.4 |
250.1 |
11.2 |
| 499.8 |
250.9 |
10.4 |
| 499.5 |
248.8 |
9.1 |
| 500.1 |
250.9 |
12.5 |
| 500.6 |
248.3 |
11.8 |
| 500.8 |
242.9 |
9.9 |
| 500.8 |
248.5 |
9.9 |
| 500.5 |
246.9 |
9.0 |
| 499.4 |
250.8 |
11.8 |
| 500.9 |
250.3 |
11.1 |
| Mean value |
| |
248.8 |
10.7 |
| Deviation / Relative deviation (%) |
|
| |
2.5 (1.0) |
1.2 (11.2) |
* Certified value: not available
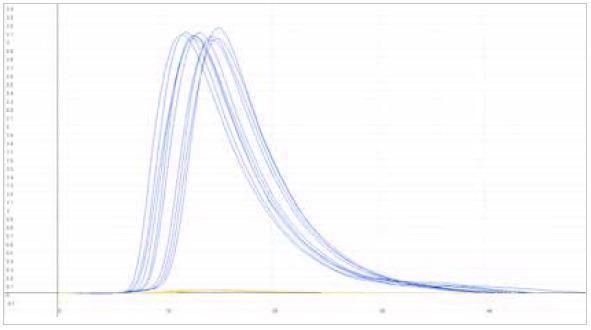
| Measuring graph |
|
| blue peak: carbon signal |
yellow peak: sulfur signal |
| x-axis: time (sec) |
y-axis: intensity (voltage) |
Image Credit: ELTRA GmbH
c) Analysis of Iron/Nickel Feedstock
Table 14. Source: ELTRA GmbH
| . |
. |
| Analysis |
Oxygen, nitrogen and hydrogen with ELEMENTRAC ONH-p 2 |
| Sample |
Customer sample: iron/nickel powder |
| Sample preparation |
Sample filled in nickel capsule |
| Settings |
Standard steel analysis with 4500 W (ON)
Standard steel analysis with 3600 W (H) |
Table 15. Source: ELTRA GmbH
| Typical results |
Customer sample
Fe/Ni powder |
| Weight (mg) |
Oxygen (ppm) |
Nitrogen (ppm) |
| 158 |
479 |
327 |
| 154 |
473 |
328 |
| 152 |
455 |
330 |
| 157 |
457 |
330 |
| Mean value |
| |
466 |
329 |
| Deviation / Relative deviation (%) |
| |
11.8 (2.5%) |
1.47 (0.4%) |
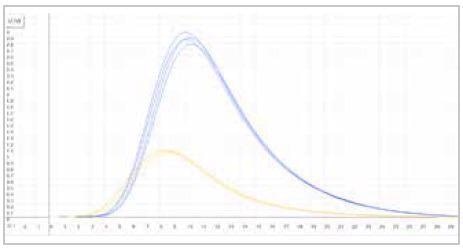
| Measuring graph |
|
| blue peak: oxygen signal |
yellow peak: nitrogen signal |
| x-axis: time (sec) |
y-axis: intensity (voltage) |
Image Credit: ELTRA GmbH
For reliable hydrogen measurements, the ELEMENTRAC ONH-p 2 uses a TC cell and the less expensive carrier gas - nitrogen. Generally, hydrogen leaves the sample in elemental form and necessitates a reduced power analysis for a repeatable measurement:
Table 16. Source: ELTRA GmbH
| Typical results |
Customer sample
Fe/Ni powder |
| Weight (mg) |
Hydrogen (ppm) |
| 399 |
11.8 |
| 400 |
11.9 |
| 402 |
13.5 |
| 399 |
11.78 |
| Mean value |
12.28 |
| Deviation |
0.83 |
| Relative deviation (%) |
6.8 |
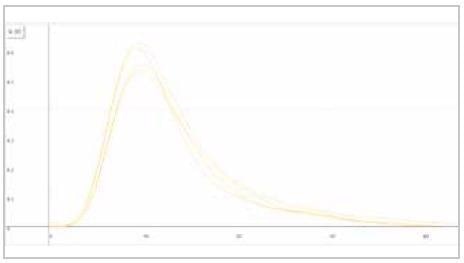
| Measuring graph |
|
| yellow peak: hydrogen signal |
|
| x-axis: time (sec) |
y-axis: intensity (voltage) |
Image Credit: ELTRA GmbH
After two weeks, the measurement was repeated for additional analysis of the stability of the oxygen results. The customer sample was kept in a sealed transparent plastic bag.
Table 17. Source: ELTRA GmbH
| . |
. |
| Fe/Ni feedstock: New measurement after 2 weeks of storage in a plastic bag |
| Oxygen (N=4) |
469 +- 10.9 ppm |
| Nitrogen (N=4) |
333 +- 3.6 ppm |
Similar to the ASTM sample, no notable increase of the measured oxygen or nitrogen content could be seen.
Table 18. Source: ELTRA GmbH
| . |
. |
| Analysis |
Carbon and sulfur with ELEMENTRAC CS-i |
| Sample |
Iron/Nickel feedstock (customer sample) |
| Sample preparation |
None |
| Settings |
Accelerator 1.7 g tungsten
Cycle time: 90 seconds/ analysis |
Table 19. Source: ELTRA GmbH
| Typical results |
Customer sample
Iron/Nickel Feedstock |
| Weight (mg) |
Carbon (ppm) |
Sulfur (ppm) |
| 500.4 |
176.3 |
153.5 |
| 500.3 |
186.6 |
166.1 |
| 500.4 |
183.7 |
166.2 |
| Mean value |
| |
182.2 |
161.9 |
| Deviation / Relative deviation (%) |
| |
5.3 (2.9) |
7.3 (4.5) |
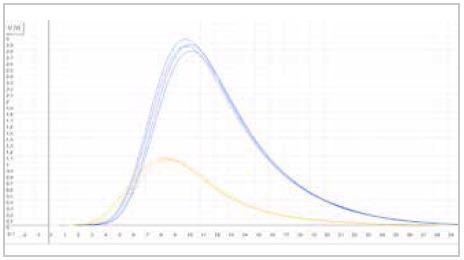
| Measuring graph |
|
| blue peak: carbon signal |
yellow peak: sulfur signal |
| x-axis: time (sec) |
y-axis: intensity (voltage) |
Image Credit: ELTRA GmbH
d) Oxygen and Hydrogen Analysis in Precious Metals
Table 20. Source: ELTRA GmbH
| . |
. |
| Analysis |
Oxygen and hydrogen with the ELEMENTRAC ONH-p 2 |
| Sample |
Customer sample: PD sponge |
| Sample preparation |
Sample filled in nickel capsule for H analysis
Sample filled in nickel capsule and basket for ON analysis |
| Settings |
Standard titanium analysis with 5600 W (ON)
Standard titanium analysis with 3600 W (H) |
Due to the expense, precious metals like gold, platinum or palladium are not in extensive use for feedstocks in additive manufacturing. As a result of their high melting point, the analysis of oxygen, nitrogen and hydrogen is almost identical to the analysis of titanium.
Compared to steel- or titanium-based feedstock, the carbon, sulfur and nitrogen content is typically deemed less important, and as such, was not measured in this example.
Table 21. Source: ELTRA GmbH
| Typical results |
Customer sample
Pd sponge |
| Weight (mg) |
Oxygen (ppm) |
| 69 |
361 |
| 76 |
330 |
| 81 |
360 |
| Mean value (ppm) |
350 |
| Deviation |
17 |
| Relative deviation (%) |
4 |
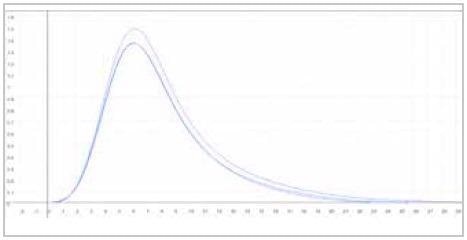
| Measuring graph |
|
| blue peak: oxygen signal |
|
| x-axis: time (sec) |
y-axis: intensity (voltage) |
Image Credit: ELTRA GmbH
Table 22. Source: ELTRA GmbH
| Typical results |
Customer sample
Pd sponge |
| Weight (mg) |
Hydrogen (ppm) |
| 69 |
30 |
| 56 |
36 |
| 56 |
34 |
| Mean value (ppm) |
33 |
| Deviation |
3 |
| Relative deviation (%) |
9.5 |
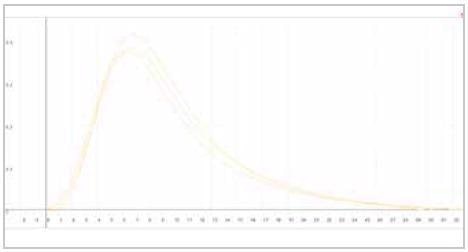
| Measuring graph |
|
| yellow peak: hydrogen signal |
|
| x-axis: time (sec) |
y-axis: intensity (voltage) |
Image Credit: ELTRA GmbH
Table 23. Source: ELTRA GmbH
| . |
. |
| Analysis |
Oxygen and hydrogen |
| Sample |
Customer sample: Pt sponge |
| Sample preparation |
Sample filled in nickel capsule for H analysis
Sample filled in nickel capsule and basket for ON analysis (fig. 7) |
| Settings |
Standard titanium analysis with 5600 W (ON)
Standard titanium analysis with 3600 W (H) |
Table 24. Source: ELTRA GmbH
| Typical results |
Customer sample
Pt sponge |
|
| Weight (mg) |
Oxygen (ppm) |
| 93 |
301 |
| 86 |
321 |
| 109 |
327 |
| Mean value (ppm) |
316 |
| Deviation |
13 |
| Relative deviation (%) |
4 |
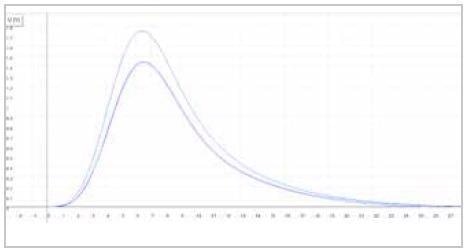
| Measuring graph |
|
| blue peak: oxygen signal |
|
| x-axis: time (sec) |
y-axis: intensity (voltage) |
Image Credit: ELTRA GmbH
Table 25. Source: ELTRA GmbH
| Typical results |
Customer sample
Pt sponge |
|
| Weight (mg) |
Hydrogen (ppm) |
| 74 |
31 |
| 124 |
26 |
| 117 |
27 |
| Mean value (ppm) |
28 |
| Deviation |
2.5 |
| Relative deviation (%) |
8.9 |
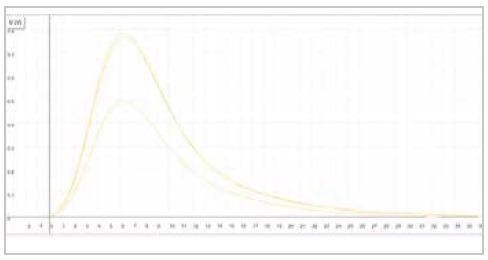
| Measuring graph |
|
| yellow peak: hydrogen signal |
|
| x-axis: time (sec) |
y-axis: intensity (voltage) |
Image Credit: ELTRA GmbH
Conclusion
The ELTRA ELEMENTRAC series makes analysis of feedstock, granulates and other powders safe, straightforward and reliable. The ELEMENTRAC CS-i and ONH-p2 ensure precise measurements when analyzing different materials such as iron, nickel and even platinum and palladium across a wide concentration range.
The publication of the DIN EN ISO/ASTM 52907 is an excellent starting point for the quality control process of feedstock, but a more comprehensive guide could prove useful to ensure reliable measurement results.
This is especially true where process steps such as sampling, preparation and storage of feedstocks are concerned and should be evaluated further in the future to guarantee valid C/S and O/N/H measurements over a broad sample range and a prolonged period of time.

This information has been sourced, reviewed and adapted from materials provided by ELTRA GmbH.
For more information on this source, please visit ELTRA GmbH.