Polymer materials are employed in a huge array of applications across the various facets of contemporary society, from packaging materials to aerospace engineering. Virtually every application demands specific, often differing, properties. These properties are primarily determined by the structure of the polymer product.
Fast, Dynamic Analysis with Benchtop XRD. Video credit: Thermo Fisher Scientific – Materials & Structural Analysis
Key observables for polymer materials include the type of polymer – for example, polyethylene (PE) or polypropylene (PP) – or its crystallinity. Polymers also exhibit varying microstructures, much like those found in common metal alloys, like steel. These microstructures also influence polymer materials’ mechanical properties.
It is widely recognized that the introduction of additives or pigments to polymer matrices facilitates the finetuning of different properties, such as optical or physical properties.
It is important that users and producers in highly industrialized environments are able to rapidly screen products to ensure they possess appropriate properties.
One straightforward and quick way to perform this screening lies in the use of X-ray diffraction (XRD) combined with whole pattern Rietveld refinements. This approach represents an ideal solution for QC/QA or research-related applications.
In a recent study, the Thermo Scientific™ ARL™ EQUINOX 100 Diffractometer was used to evaluate a number of key polymer properties.
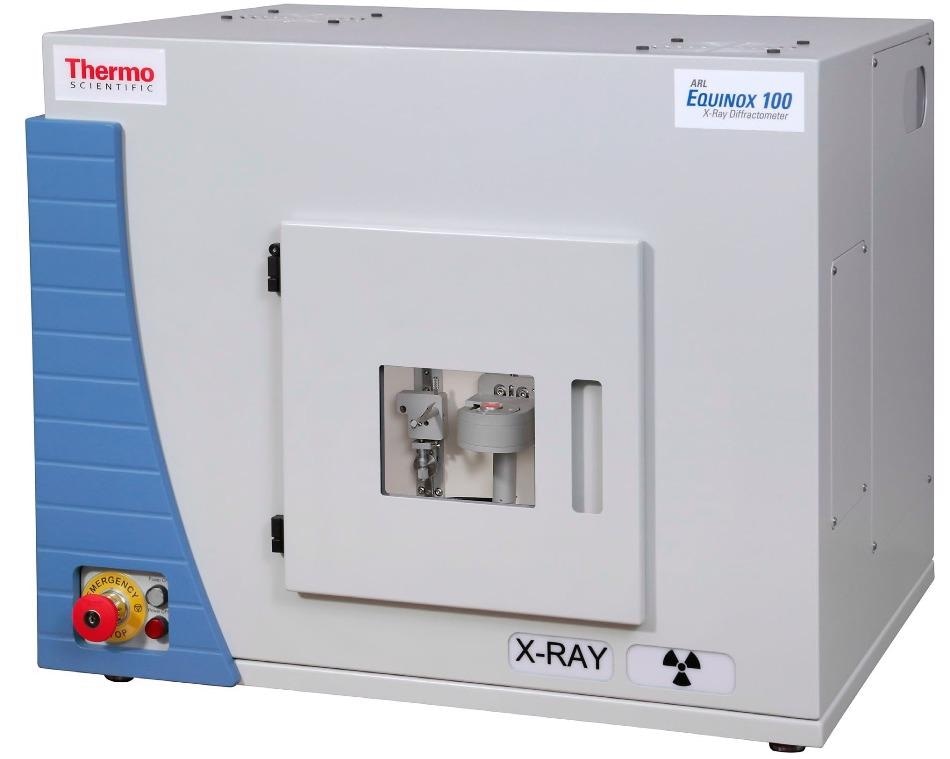
Thermo Scientific ARL EQUINOX 100. Image Credit: Thermo Fisher Scientific – Materials & Structural Analysis
Identification of Type and Polymorphism
After analysis, a comparison of acquired results to the ICDD PDF4+ Organic database clearly confirmed that the results showed high-density Polyethylene (HDPE) and Isotactic Polypropylene.
Additional qualitative phase analyses confirm the presence of Polyethylene (PE) and Polypropylene (PP) type materials.
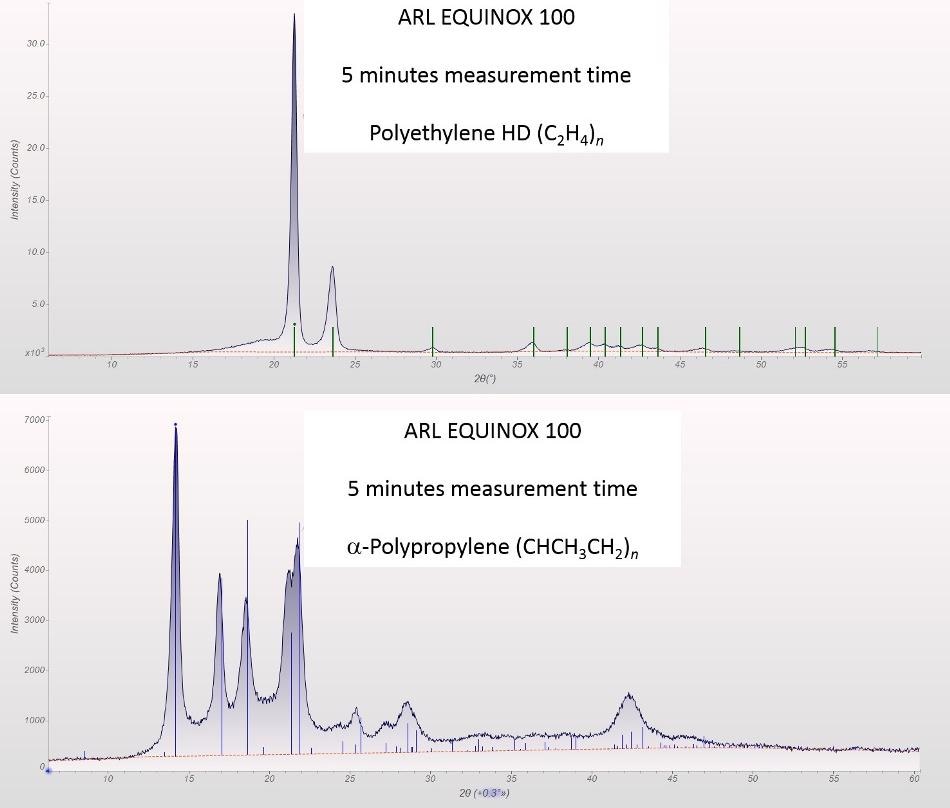
Image Credit: Thermo Fisher Scientific – Materials & Structural Analysis
Degree of Crystallinity (DOC)
By using MDI JADE 2010, it is possible to directly determine D via a standardless refinement method. This approach involves the intensity of the amorphous contribution being directly determined by deconvoluting the diffraction pattern via Rietveld’s method.
In this example, a calculation of the amorphous content (in w%) used a density of 0.85 g/cm3, confidently providing results for both PE and PP samples with high and low D values.
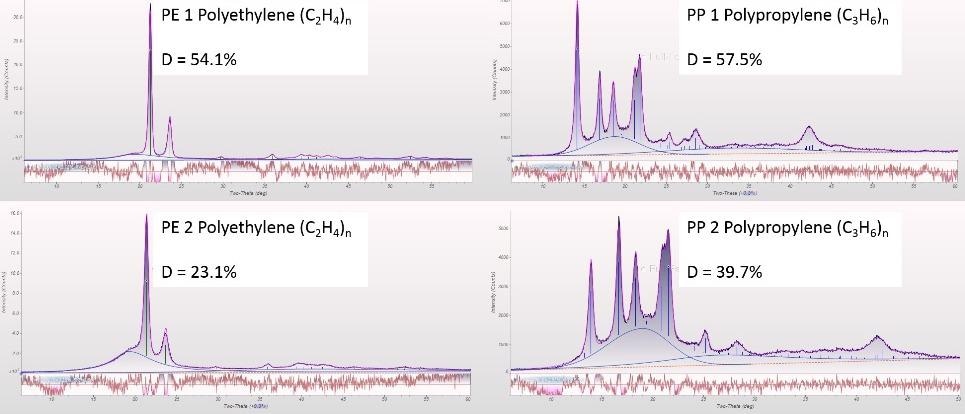
Image Credit: Thermo Fisher Scientific – Materials & Structural Analysis
Polymorphism and Crystallite Size
A comparison of the acquired data to the ICDD PDF4+ Organic database highlights predominantly β-PP (blue) and traces of α-PP (grey). Domain sizes were found to differ between β-PP (33 nm) and α-PP (10 nm).
It should be noted that the intergrowth structure of α-PP and β-PP is central to the resulting material properties, prompting this observable to be widely used in industrial applications.
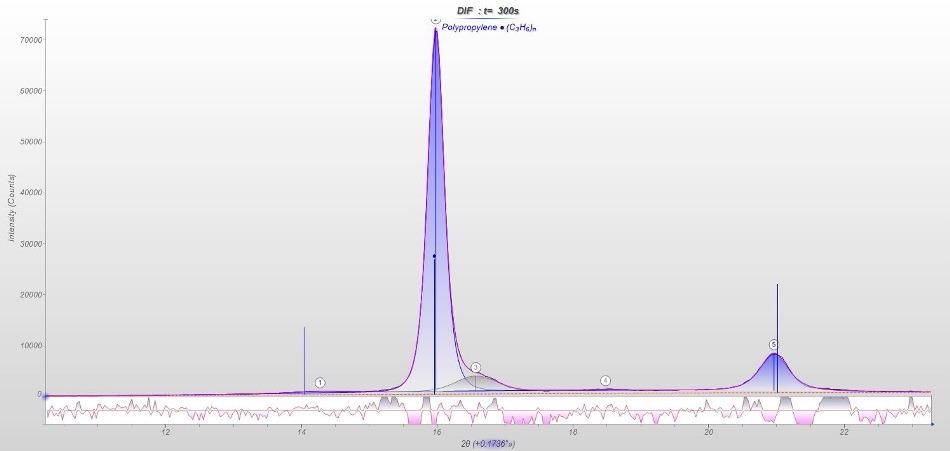
Image Credit: Thermo Fisher Scientific – Materials & Structural Analysis
Additives and Pigments
In the example presented here, the application of XRD to a resin sample with embedded Al and TiO2 (rutile) particles quantified an amorphous content of 98% (XRF:98%), 0.9% TiO2 (XRF: 0.74%) and 1.1% Al (XRF: 1.16%).
These results were achieved via Whole Pattern Rietveld refinement with MDI JADE 2010, which affords users a robust and standardless method for the quantification of amorphous content.
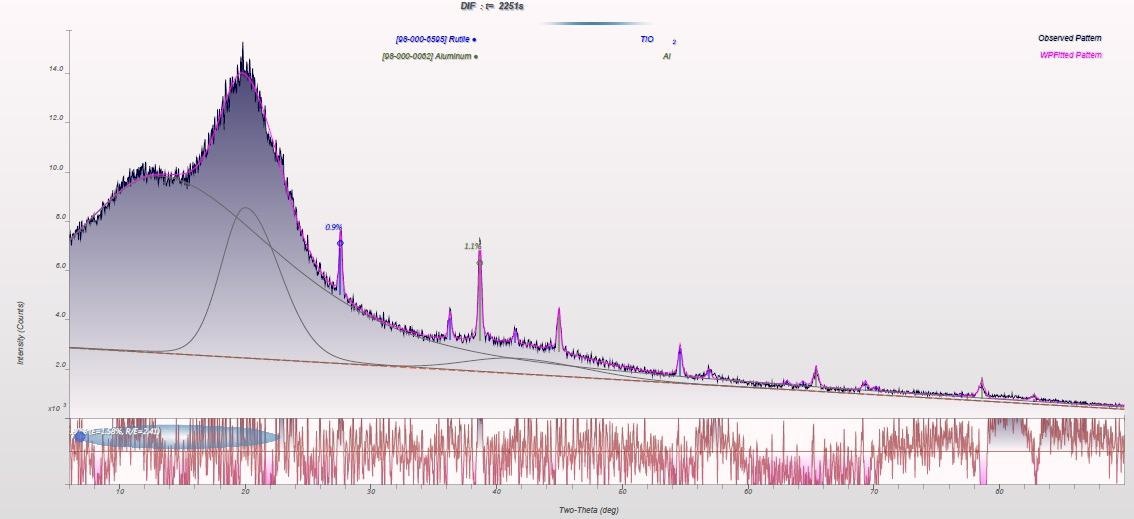
Image Credit: Thermo Fisher Scientific – Materials & Structural Analysis
Instrumentation and Experimental
The Thermo Scientific™ ARL™ EQUINOX 100 X-ray diffractometer features a custom-designed Cu (50 W) or Co (15 W) micro-focus tube that is equipped with mirror optics.
As the system is low wattage, this does not necessitate the use of an external water chiller or additional peripheral infrastructure. The instrument can therefore be easily transported between laboratories or from the laboratory to the field.
The ARL™ EQUINOX 100 is highly suited to both reflection and transmission measurements. The instrument also offers rapid data collection time versus other traditional diffractometers. This is due to its unique curved position sensitive detector (CPS), which is able to simultaneously measure all diffraction peaks in real-time.
In the XRD measurements highlighted here, sheet samples of PE (polyethylene) and PP (polypropylene) were measured in transmission geometry for 5 minutes. The resin sample was measured for a total of 38 minutes using Cu-Kα radiation.
The obtainable data quality from the benchtop ARL™ EQUINOX 100 is comparable to that of a common high-power floor-standing instrument.
In the example presented here, both qualitative and quantitative analysis was undertaken using MDI JADE 2010 and the ICDD PDF4+ Organic database.
Acknowledgments
Produced from materials originally authored by Ju Weicai, Raphael Yerly and Dr. Simon Welzmiller from Thermo Fisher Scientific.

This information has been sourced, reviewed and adapted from materials provided by Thermo Fisher Scientific – Materials & Structural Analysis.
For more information on this source, please visit Thermo Fisher Scientific – Materials & Structural Analysis.