The Monarc® Pro system is able to provide a full analysis of cathodoluminescence (CL) emissions, allowing both expert and novice users to capture excellent quality data in virtually every scenario.
Context
There are a number of benefits to using ultra-wide bandgap (UWBG) materials such as diamond, Al(Ga)N, BN and Ga2O3 in high-frequency and high-power electronic and optoelectronic devices functioning at deep ultraviolet (UV) wavelengths.
A number of UWBG materials also enhance the operation of these devices in extreme environments, particularly where high temperatures or the risk of radiation damage limit the possibility of using other materials.
In order for devices to be commercially viable, these must be developed using high-quality materials which exhibit minimal defects.
The UWBG (>3.4 eV) precludes the use of the photoluminescence setups typically utilized in process development because these materials are transparent at the laser wavelengths routinely employed. An alternative spectroscopic technique is therefore necessary.
Materials and Methods
Spectroscopic cathodoluminescence was used to analyze hexagonal boron nitride (h-BN) with a bandgap ~5.5 – 6.0 eV. This involved a scanning electron microscope’s (SEM) focused electron beam being used to excite electron-hole pairs in h-BN.
A Monarc Pro system was equipped with a UV-optimized diffraction grating (600 l/mm blazed at 300 nm). This was used to capture and analyze the radiative decay of the excess carriers that result in photon emissions.
Hyperspectral data – which includes both spatial and spectral information - was collected using the spectrum imaging technique.
This saw the SEM’s focused electron beam being scanned across the sample’s surface according to a predetermined pattern, with a wavelength-resolved spectrum recorded at each individual location.
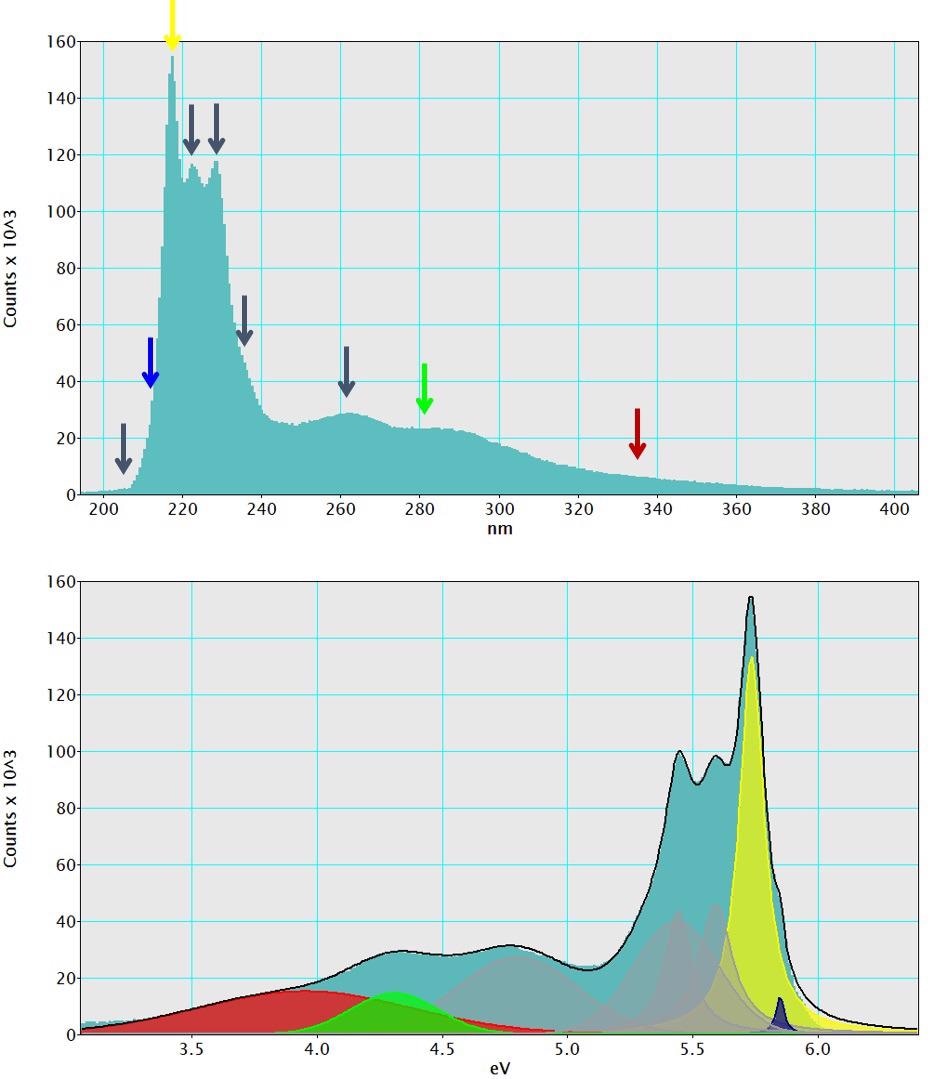
Working at room temperature, the near-bandgap luminescence (200 – 400 nm, 3.10 – 6.19 eV) associated with Frenkel excitons was analyzed, alongside any defect or impurity color centers1 (Figure 1).

Figure 1. CL spectrum of the UV luminescence of an h-BN flake recorded at room temperature. Deconvolution of the spectrum using non-linear least squares (NLLS) fitting revealed nine peaks corresponding to near-bandgap exciton emission and mid-gap color centers. The four models used to extract the maps displayed in Figure 2 are colorized consistently between Figures and the black line is the sum of all models demonstrating an excellent fit to the raw data. Image Credit: Gatan Inc.
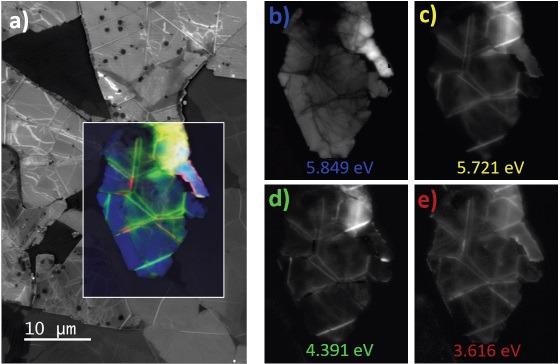
A strong spatial variation was noted in the emission lines. This was revealed through the generation of maps extracted via a non-linear least-squares fitting (Figure 2).

Figure 2. a) Secondary electron image of h-BN flakes overlaid with a colorized representation of a CL spectrum image; b) – e) maps extracted by NLLS fitting as shown in Figure 1. The colorized image in a) is a composite image formed from maps b) – e) and colorized consistently. Acquisition conditions (Figures 1 and 2): accelerating voltage = 10 kV, probe current = 1 nA, exposure time = 100 ms, spectrometer resolution = 0.67 nm. Image Credit: Gatan Inc.
Summary
The study presented here demonstrated the collection of hyperspectral data at room temperature as part of an investigation into the properties of a UWBG semiconductor comprised of hexagonal boron nitride.
The Monarc Pro system’s unparalleled sensitivity and advanced optical design ensure the sharpest spectra and images, meaning that variations in exciton behavior and defect distribution could be mapped at the highest spatial resolution.
References
- M Silly et al., Phys. Rev. B 75(8) 085205 DOI: 10.1103/PhysRevB.75.085205

This information has been sourced, reviewed and adapted from materials provided by Gatan Inc.
For more information on this source, please visit Gatan Inc.