The Monarc® Pro system delivers the most complete analysis of CL emissions and grants all users the power to acquire the highest quality data, from novice to expert.
Context
The structures, compositions and history of different geological specimens can be ascertained with the application of CL microscopy, where the spatial and/or spectral variation in the luminescence signal of a mineral-thin section shows the distribution(s) of trace elements to model the geological history.
In spite of the polarization studies being a key element in the optical microscopy analysis of mineral-thin sections, the polarization state of the CL signal has been largely neglected. This is assumably due to the lack of appropriate analysis tools.
Materials and Methods
The Monarc Pro CL system was installed on a scanning electron microscope to determine the degree of polarization and its direction in a chondritic meteorite specimen from Miller Range 090010.

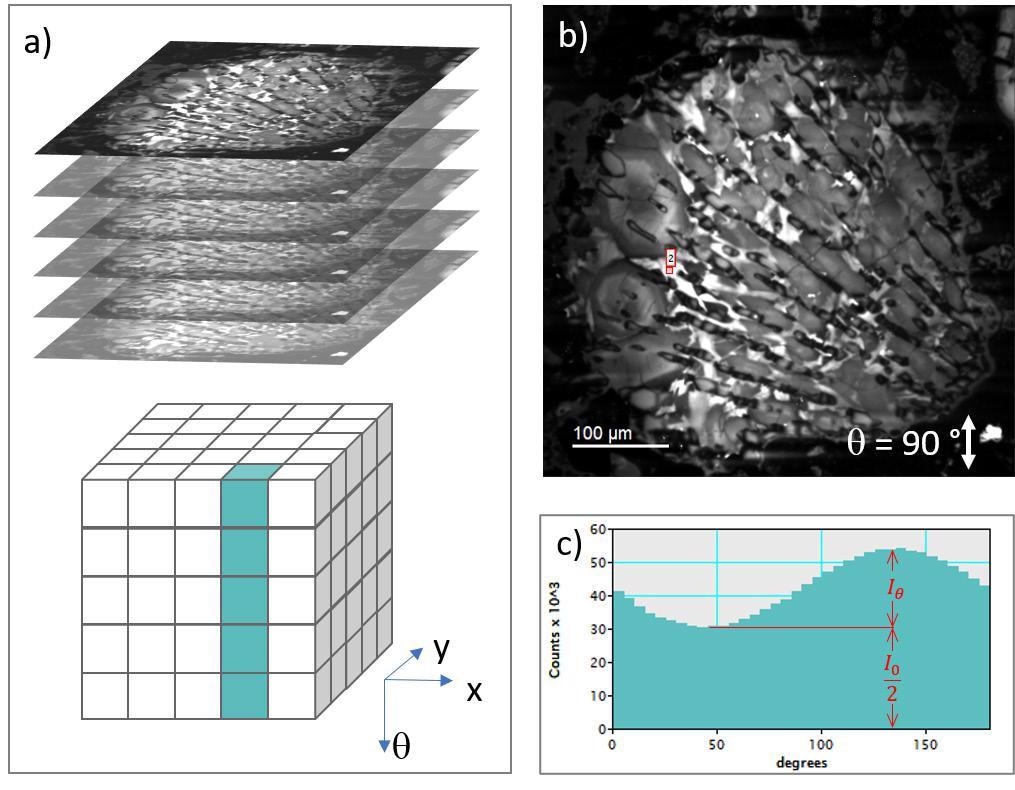
Figure 1. a) Schematic representations of a polarization-filtered spectrum image, b) polarization-filtered CL intensity map (θ = 90 ± 2.5°) of a chondritic meteorite meteorite, and c) polarization-filtered CL intensity plot, Iθ, at the indicated location in b). Image Credit: Gatan Inc.
Utilizing the MultiMap feature of Monarc’s DigitalMicrograph® software and an optional rotatable, broadband linear polarization filter (P/N 450.P.U1.3), a polarization spectrum image — a coordinated stack of polarization filtered CL images — was generated, as shown in Figure 1.

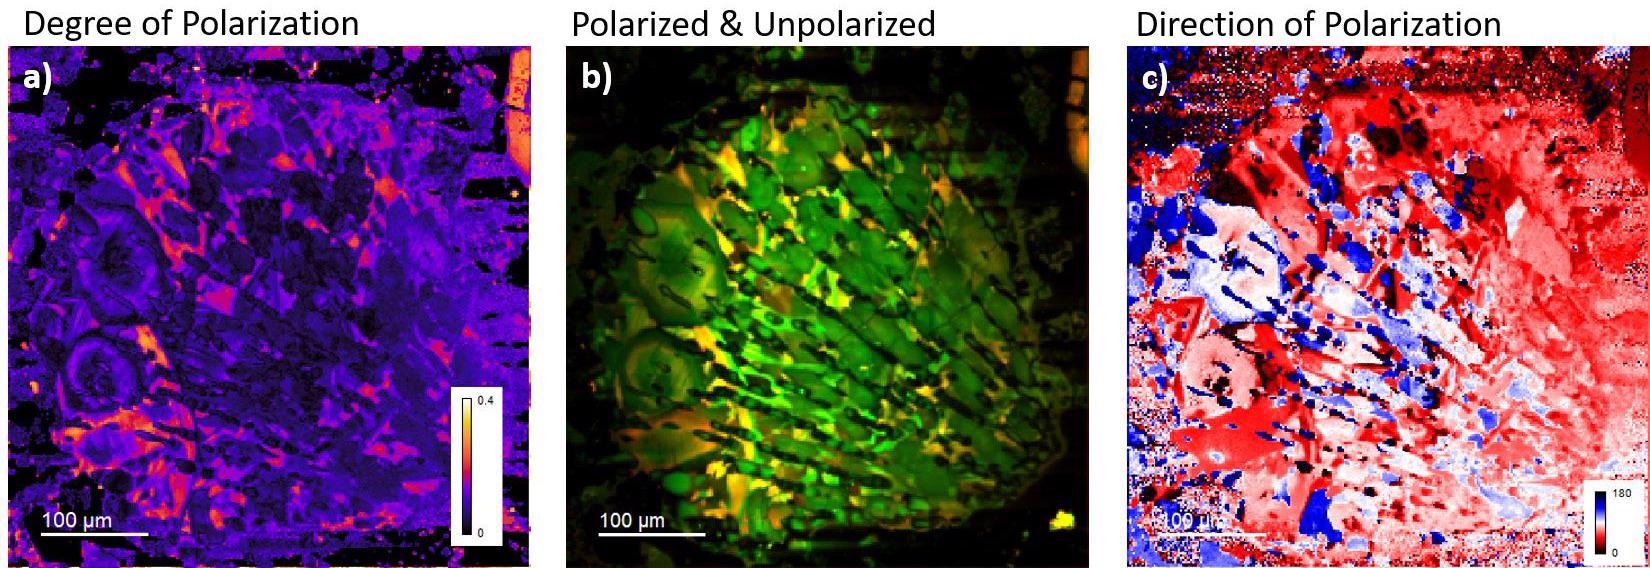
Figure 2. Fit maps extracted from the polarization filtered spectrum image showing a) degree of polarization DP, b) polarized Iθ (red) and unpolarized I0 (green) component, and c) polarization angle θ0. Image Credit: Gatan Inc.
By applying the Law of Malus to each pixel in the data cube, maps of the degree of polarization, DP=IP/(IP+I0), the polarization angle θ0, and the unpolarized component, I0, were extracted; it was assumed that the sample was the first polarizer, θ0, and the Monarc’s rotatable polarizer angle, θ were pulled from the polarization spectrum image:

Summary
Acquisition of the degree of polarization and polarization direction maps from a geological specimen using the Monarc Pro system has been demonstrated in this investigation.
The crystals in the sample serve as the first polarizer in a polarization analyzer, with the subsequent maps potentially uncovering crystal orientation in the emitting crystal.
This experiment acts as proof of concept for establishing crystal orientation employing CL in the scanning electron microscope and could be used to identify the birefringence of a specimen.

This information has been sourced, reviewed and adapted from materials provided by Gatan, Inc.
For more information on this source, please visit Gatan, Inc.