Solid, gage-proven metrology is a critical tool for process control across all industrial settings. A good measurement system allows manufacturers to keep parts within tight specification limits.
These limits range from factories operating 24/7 and incorporating high-volume, high-end processes to medical instrument production complying with stringent FDA inspections.
However, if the measurement system is not suitable and the amount of measurement error surpasses the permissible tolerance, it may erroneously disregard and reject good parts while accepting bad parts.
Thus, the ability for a company to comply with ever-changing standards contributes to product and process innovation and allows a company to remain competitive in modern markets, which depends upon the ability to measure system performance with the greatest accuracy.
It should be of no surprise then that gage studies for metrology measurement system performance testing and validation are now a common feature.
Such gage studies are a good technique determining and demonstrating the ability of a measurement system’s to comply with given manufacturing specification tolerances, as well as its viability for its intended purpose.
This article highlights gage studies and Bruker’s latest metrology developments that help manufacturers and engineers comply with increasingly stringent demands for high-end applications.
Measurement System Error
Measurement systems are ultimately developed and purchased with the requisite accuracy needed to measure a part to a known calibration standard that is conclusively traceable and compliant with a national governing body, such as NIST (National Institute of Standards and Technology) in the United States, NPL (National Physical Laboratory) in the UK, JISC (Japan Industrial Standards Committee, or PTB (Physikalisch-Technische Bundesanstalt) in Germany.
An appropriate measurement system necessitates repeatability and accuracy (precision) to secure the necessary standard for a particular measurement.
Given the accelerated evolution of today’s industrial standards, it is not unusual – either during measurement system development or deployment – to determine system errors that can undermine product quality and other manufacturing process outcomes.
The majority of measurement system errors can be placed into one of the following categories: accuracy, linearity, repeatability, reproducibility, stability and bias.
Figure 1 visualizes a variety of accuracy and repeatability errors, including both singular and concurrent errors, with the center bull’s-eye symbolizing the part manufacturing target ideal specification.

Figure 1. Target representation of accuracy and repeatability. Image Credit: Bruker Nano Surfaces
Gage Studies
To determine and fully grasp the potential measurement system errors, manufacturers conduct gage studies.
The scope of a true gage study – typically known as a Gage Repeatability and Reproducibility (GR&R) study – not only takes into consideration the ability and performance of the measurement tool but also takes into account the capabilities of the manufacturing instrument(s), operators, environment, and parts.
Throughout a GR&R study, the number of measurement errors characterized by the repeatability and reproducibility of a system facilitates the ability to determine the performance impact of such system variables.
The quantitative “repeatability” of a measurement system outlines the differences in observed measurements when the same operator uses the same instrument to measure the same parts a number of times under identical operating conditions.
On the contrary, the “reproducibility” of a system details the amount of variation seen when various operators utilize the same instrument to measure the same parts several times. Reproducibility can also indicate the longer term stability of a measurement system using data acquired via a longitudinal study.
In simple terms, the first “R” in GR&R stands for instrument/fixturing/algorithm variation, while the second “R” represents the measurement system stability across different operators.
The GR&R study incorporates both gage study aspects into a part’s specifications as a percentage and contributes to the part’s overall tolerance. One benefit of the GR&R study is that it ensures the accuracy of the measurement system’s results or initially qualifies it via a systematic approach to gaging – and then enhancing – the system.
That is, if the GR&R results cannot be accepted on the first attempt, reasonable and well-documented adjustments are possible, and the GR&R can be repeated to verify that the results have been improved.
GR&R Project Setup
In any GR& R study, determining the size of the project is a crucial first step for evaluating the potential repeatability.
Included in this is the quantification of the number of parts (including the number of features to be measured on each part used for process control), how many operators are incorporated, and the number of measurements (replicates/repeats) for each operator and each part, as well as any associated costs and resources.
By completing these steps, manufacturers are able to evaluate the time and financial resources that need to be distributed to the study against the practical usability of its results.
For instance, executing a great number of measurement trials and capturing vast sets of gage data may produce more accurate results, yet doing so also demands extra time and more resources – the consequences of which are contingent on the measurement time and part cost.
Comparatively, restricting the number of repetitions to facilitate minimized resource usage may impede the reliability of the results and make the firm vulnerable to increased risk of process failure.
Standard operating procedure within a company commonly dictates GR&R project setup, though the early determination of size and the organization and analysis of data, as outlined below, largely follow the same procedure between companies.
For instance, data collection cannot start without initially developing a feasible template for recording data points.
Conventional short-term GR&R spreadsheets, as exhibited in Figure 2, might be made up of ten parts, run nine times, using three operators. It is then possible to repeat this same GR&R study across several days and combine all results to deliver long-term reproducibility.
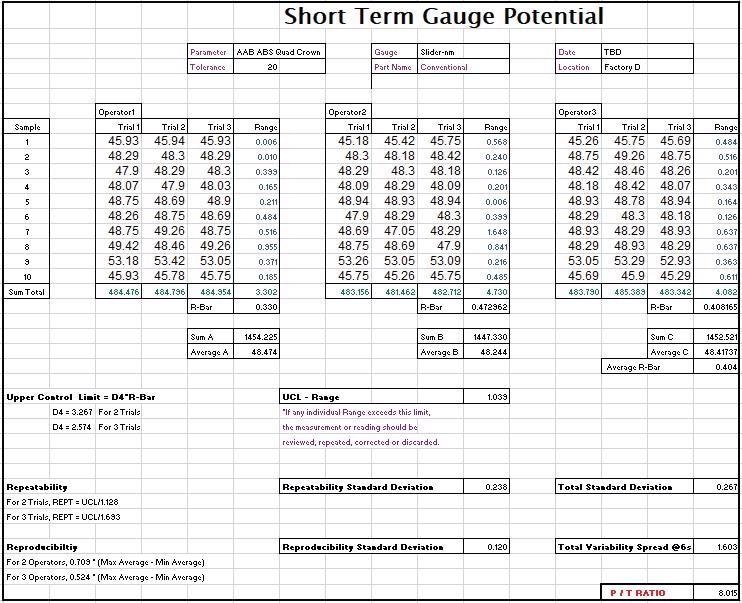
Figure 2. Short-term GR&R analysis results in nanometersy. Image Credit: Bruker Nano Surfaces
A number of conventional analysis variations can be applied to calculate the GR&R results. A simple X-bar and R-chart, traditionally completed by hand, is now more likely to draw information from a spreadsheet or control software, which then graphs the data captured with the tolerance bars being the part tolerance.
However, this method is typically deemed to be less accurate and is generally used more for process control. The aforementioned short-term GR&R spreadsheet analysis or an even more sophisticated ANOVA analysis, which requires specialized computer software, are thought to be the most accurate methods.
These analyses of the GR&R data can offer information on part variation, standard deviation, repeatability, reproducibility and percent of total variation, in contrast to the lone percent of part tolerance.
GR&R studies results can be evaluated by the resulting Standard Deviation in the units the data was captured in or as a percentage of the part process tolerance (P/T ratio).
Figure 2 shows how the part tolerance was recorded into the header, and the P/T ratio is determined in the lower right corner.
If the GR&R results are reported in percent of process tolerance, numerous high-precision manufacturing facilities request that the measurement system or gage tolerance contribution is less than 10% of that part’s process tolerance.
A P/T ratio < 20% indicates that the measurement tool can keep up with process tolerance, where a larger P/T ratio risks a false positive measurement.
Maintaining Good Gage Performance
Prior to conducting an initial GR&R study, the measurement system must be assembled and calibrated to the manufacturer’s specifications. Long-term standard measurements must be carried out at periodic calibration cycles to a known traceable standard to preserve the measurement system’s traceability and correlation.
When conducting a periodic calibration on a measurement system, the standard must first be measured prior to making any adjustments.
This initial measurement not only determines the occurrence of any drift in the measurement system but makes sure that adjustments only take place when the results near the calibration specification limit since continued adjustment introduces additional measurement variation to that system.
The best way to monitor the stability of a measurement system is to run “golden” part standards graphed with specifications on a periodic basis.
However, the initial GR&R is typically the last time a GR&R is conducted on the measurement system until there is a measurement problem, which is usually highlighted by vague measurements or false part fails/passes discovered during a customer part audit.
To prevent any “surprise” incidents, the best practice is to conduct a periodic GR&R of a measurement system with the golden parts. Periodic degrading of a GR&R can highlight issues with the measurement system itself or reveal new environmental effects.
Good practices are crucial to ensure good maintenance of initial GR&R parts (or a subset of them) to gage or requalify the measurement system periodically after repair or maintenance.
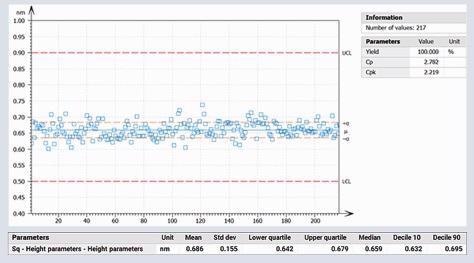
Figure 3. Advanced plot for long-term reproducibility on RMS areal roughness (Sq in nanometers) versus specified limits (upper a lower control limits). Image Credit: Bruker Nano Surfaces
The Advantages of White Light Interferometry and Self-Calibration
Metrology instruments that use white light Interferometry (WLI) are non-destructive, non-contact and are among the most repeatable measurement systems available on the market today.
They offer true three-dimensional images rapidly over a large area that completely characterizes the surface with subangstrom repeatability.
Numerous factors can contribute to the aforementioned measurement errors, and Bruker’s WLI profilers have been designed to specifically minimize these random and systematic errors with a core designed measurement component and best-in-class environmental isolation.
All Bruker WLI tools come with some form of standard or optional integrated active air isolation. Air isolation mounts facilitate precise, vibration-free measurements in all working environments.
Low-noise digital cameras with ultralow-noise electronics help with the delivery of true characterization of the surfaces under test.
The measurement head, tip-tilt cradles, and covers have been developed specifically to enhance vibration and acoustic isolation in extreme production environments. The tool-base castings have been designed using CAD and modeled for optimal part isolation, as well as for minimum deformity resulting from the environment (see Figure 4).
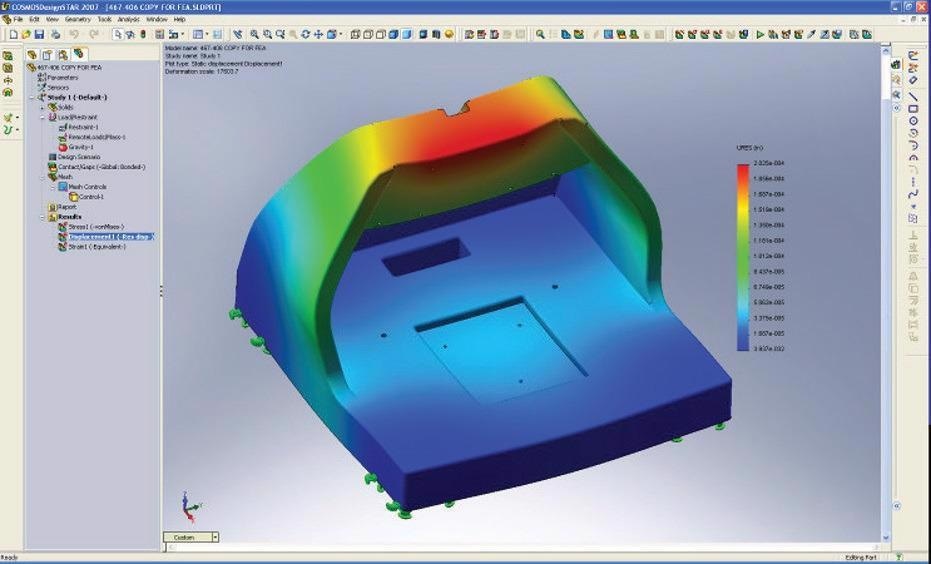
Figure 4. CAD modeling of base casting. Image Credit: Bruker Nano Surfaces
Bruker’s high-end WLI measurement systems include an industry-leading laser interferometry reference signal module that tracks each measurement, as seen in Figure 5.
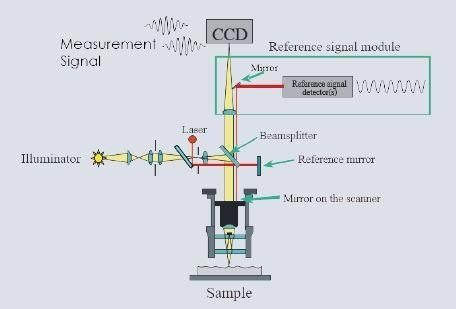
Figure 5. Schematic of WLI components and reference signal module with HeNe laser. Image Credit: Bruker Nano Surfaces
This kind of technology is referred to as secondary level traceable internal standard, which is near to an absolute standard as the traceable accuracy to the known wavelength of its stabilized HeNe laser (632.82±0.01nm) is a key feature.
Every single measurement is continuously tracked and adjusted accordingly over the entire measurement scan to reduce any short-term mechanical irregularities and any long-term thermal environmental drift.
This self-calibration HeNe laser was built into the measurement system to eliminate any significant measurement design errors from Abbe error (lateral offset between the reference signal and optical measurement axis), cosine error (angular offset between the reference signal and scan axis) and dead path error (irregularities between the two laser reference signals).
Not all industries need the precision of a WLI-based system with this self-calibrating reference signal technology, but it is essential for several advanced applications in automotive, aerospace, data storage, MEMS, optics, precision machining, medical semiconductor or precision film industries.
Self-calibration significantly enhances the accuracy of a system over time while boosting tool-to-tool correlation in manufacturing plants across the world.
Figure 6 exhibits a 23-µm height measurement with an intense ambient temperature shift where the self-calibration reference signal eliminates the tens-of-nanometers thermal expansion error introduced to the whole volume of the tool.
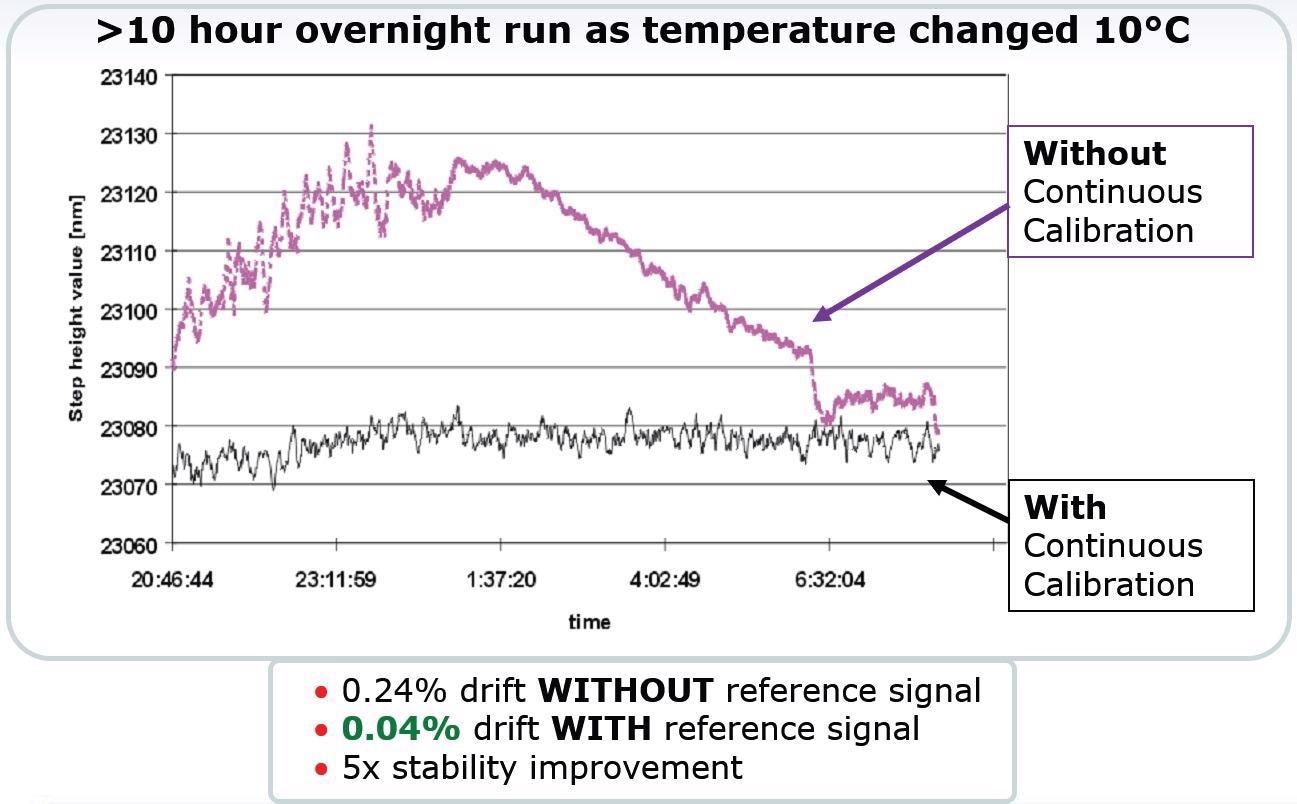
Figure 6. 23 μm step height measurement WITH and WITHOUT use of the continuous self-calibration HeNe laser assembly. Image Credit: Bruker Nano Surfaces
All Bruker WLI profilers have been developed with stabilized, consistent LED illumination that offers best-in-class image quality at any magnification. Bruker also has collaborated with major objective manufacturers on the development of interferometer objectives, making them thermally stable (Figure 7).
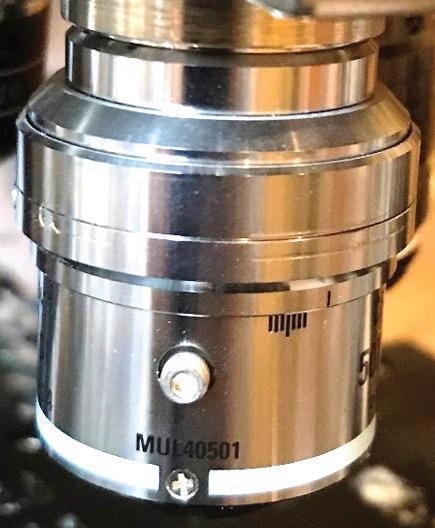
Figure 7. A specially designed 50x-thermal objective. Image Credit: Bruker Nano Surfaces
All Bruker WLI measurement systems come with stabilized optics and lighting as standard, yielding measurement stability for enhanced GR&R capability. Bruker has also designed customized software and has integrated it into the multi-core 64-bit Vision processing software to enhance repeatability and gaging of the measurement systems.
Phase-shifting algorithms for the acquisition of mirror-like surface measurements that are indifferent to noise and vibration come as standard on all systems. Variations of Vision’s automatic pattern-matching software can determine a measurement feature for alignment, center the part, or center the current capture image for analysis.
This kind of measurement part centering gets rid of the need for user intervention, thereby optimizing efficiency while achieving the best-possible measurement gage capacity by measuring the part in a repeatable location.
Even the automated detection and analysis software has integrated pattern finding to achieve optimum GR&R (see Figure 8).

Figure 8. Automation function (a) and pattern finding (b) capabilities remove variabilities and minimize operator impact. Image Credit: Bruker Nano Surfaces
For several years, WLI has played a key role in the data storage industry for a variety of demanding in-process measurements. The most challenging applications demand rapid data acquisition and analysis (a matter of seconds per part) while acquiring GR&R subangstrom measurement results over numerous days.
Figure 9 demonstrates the final GR&R analysis of a three-feature part study acquired over three days to generate a final subangstrom 1-sigma reproducibility result applying the previously mentioned measurement system designs.

Figure 9. Multiple-day GR&R study results. Image Credit: Bruker Nano Surfaces
In order to calculate the total 1-sigma GR&R for each measurement part region, this study utilized custom Anova software to directly compare to the specifications as desired.
Conclusion
Solid GR&R measurement analysis helps give users confidence in the process measurement system and significantly reduces waste in production processes due to inappropriate measurement variation.
WLI non-contact optical profiling remains the best technology for high-volume throughput, ultra-accurate gaging, and long-term reproducibility for process control measurement. The main benefit of WLI over alternative optical measurement technology is its capability to accomplish equivocal subangstrom vertical resolution at any magnification.
By closely working with customers at the initial stages of their measurement road maps, Bruker consistently evolves its measurement systems continuously to address the increased number of challenges found in demanding production applications and environments.
The incorporation of a self-calibration HeNe laser module has eradicated the need for routine calibration while reducing maintenance downtime and enhancing the cost of ownership for manufacturers.
Bruker’s combination of other system enhancements and isolation offer outstanding imaging while minimizing measurement error with state-of-the-art data analysis. A variety of Bruker WLI-based profiler configurations mean it is simple to meet nearly every customer’s exact, individual measurement GR&R needs.

This information has been sourced, reviewed and adapted from materials provided by Bruker Nano Surfaces.
For more information on this source, please visit Bruker Nano Surfaces.