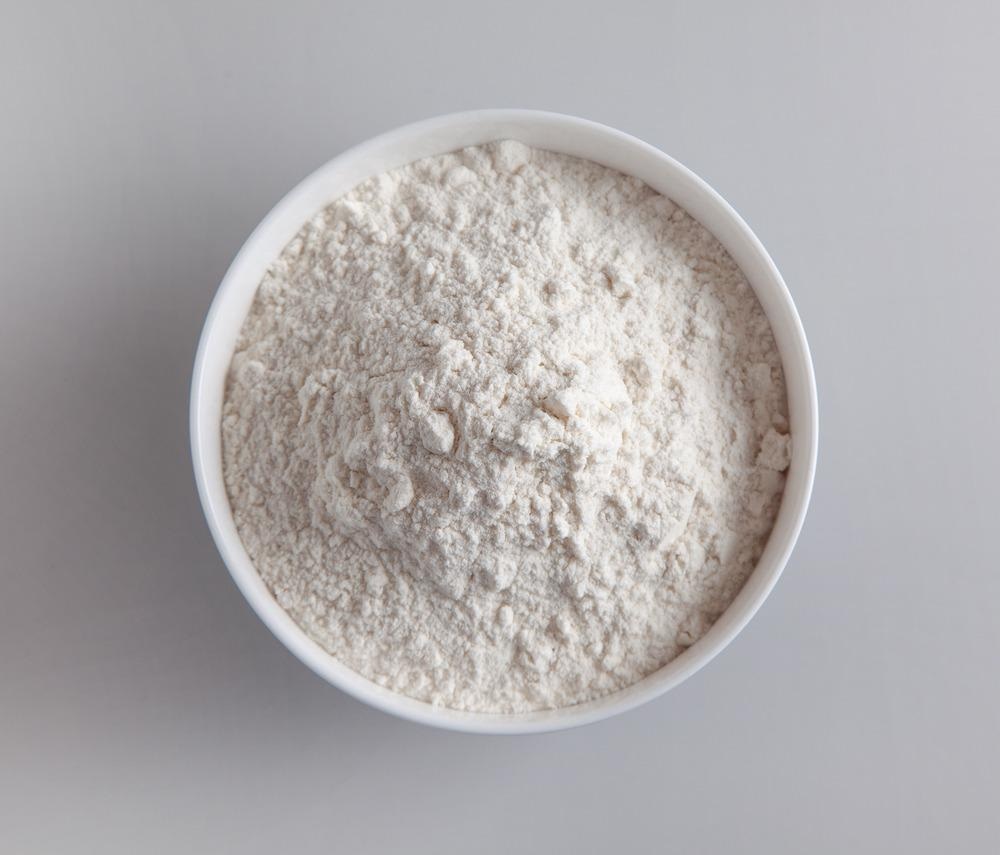
This article discusses particle size distribution analysis of flour, its importance, and different methods used for PSD analysis.

Image Credit: Rutina/Shutterstock.com
What is Particle Size Distribution Analysis?
To determine the size and range of particles in a specific material, particle size distribution (PSD) analysis is used. Several techniques are used to perform PSD analysis depending upon the question at hand and the properties of the sample. This method is applied in many industries to investigate, control, and monitor material properties.
It is critical to know the particle size distribution of agglomerates and primary particles present in materials for quality control, packaging, handling, processing, product development, and research purposes. In addition, many regulatory authorities and standard organizations are there for documentation, specification, and standardization of particle size and distribution, which indicates its importance in several industries.
There are a number of techniques used for PSD analysis depending upon several factors such as particle shape, solubility, sample concentration, sample presentation, particle size range, detection limit, and many others. The techniques for the evaluation of particle size distribution include laser distribution, near-infrared reflectance spectroscopy, and sieve analysis.
PSD Analysis of Flour
Flour has several particle sizes. Generally, flour is described by its fluffiness, granularity, silkiness, smoothness, and sharpness. To objectively evaluate flour quality, different measurements of the particle size distribution of ground wheat and flours are made. These measurement methods may include laser diffraction, Coulter Counter, sedimentation, microscopy, and sieve analysis. The factors that affect particle size are grinding time, type of grinder, wheat class, and wheat hardness.
Wheat Types and Milling Methods
There are several types of wheat generally categorized as hard and soft wheat. Hard wheat includes hard white (HW), hard red winter (HRW), hard red spring (HRS) and durum. At the same time, soft wheat includes soft white (SW), soft red winter (SRW), and club wheat. After that, wheat is tempered and cleaned on a 15 percent moisture basis. Then, different milling methods may be applied such as the micro mill, Buhler experimental mill, and Miag pilot mill.
Particle Size Analysis by Laser Diffraction
To measure the percent volume of particles distributed in selected size ranges, a Coulter LS 130 optical bench can be used. Flour is then suspended in methanol and circulated in a closed system of the optical bench. After that, particle size can be determined by laser diffraction light scattering as per Fraunhofer diffraction theory.
Particle Analysis by Sieving
Nowadays, many autosievers are being used in industries for flour particle analysis. These autosievers have a sieve stack that has sieves of different sizes. These are used to separate flour particles into different fractions following sieve mesh size. After that, sieve time is set, which includes sonic pulsing and vertical and horizontal tapping. The amplitude of the sonic pulse is generally set to 50 Hz, and is set in such a way that allows the free flow of the flour through different sieves. After that, the percentage weight of particles that went through the separate sieves is determined.
NIRP Prediction of Flour PSD
Visible spectra and NIR are then obtained from various flour samples as a log of the inverse of reflectance. Different sample spectra are arranged according to standardized distances ‘H’ from the average spectrum. Spectra having an ‘H’ value more than a particular number such as 3 are then eliminated as outliners. After that, the population is equally divided.
One part is used to define calibration constants, and the second part is used as a validation set for testing calibration equations. Calibration equations are usually developed by using partial least square regression to predict the particle size of the flour through NIR.
Summary
Generally, laser diffraction can measure the particle size distribution of flours from all types of wheat more precisely than sieve analysis. Hard wheat flours sieve more efficiently and effectively than soft wheat flours. Flour particle size is also affected by environmental factors and growing conditions, wheat type, and the milling method used. NIR can be used with high accuracy to predict the particle size distribution of flour particles.
Conclusion
Particle size distribution analysis is critically important, including for flour. Depending on the features of the sample, a variety of methodologies are employed to perform PSD analysis. This technology is used to explore, control, and monitor flour characteristics.
For quality control, packing, handling, processing, product development, and research, knowing the particle size distribution of agglomerates and primary particles present in flour is crucial. Generally, flour can be evaluated through feeling, but the results obtained from this evaluation are subjective; hence it varies from person to person. Therefore PSD analysis is extremely important for a more precise and accurate assessment of flour.
More from AZoM: Using X-Ray Fluorescence for Trace Element Identification in Food
References and Further Reading
Hareland, G. A. (1994). Evaluation of flour particle size distribution by laser diffraction, sieve analysis and near-infrared reflectance spectroscopy. Journal of Cereal Science, 20(2), 183-190. https://www.sciencedirect.com/science/article/pii/S0733521084710587?via%3Dihub
Particle Technology Labs. 2022. Particle Size Distribution. [online] Available at: <https://www.particletechlabs.com/analytical-testing/particle-size-distribution-analyses>
Disclaimer: The views expressed here are those of the author expressed in their private capacity and do not necessarily represent the views of AZoM.com Limited T/A AZoNetwork the owner and operator of this website. This disclaimer forms part of the Terms and conditions of use of this website.