Sponsored by TOFWERKReviewed by Emily MageeJun 21 2022
Cleanrooms are facilities where the cleanest possible conditions are necessary for industrial research or production. Given that cleanrooms are designed to maximize production rates and yields for environmentally sensitive materials (microelectronics) and processes (wafer fabrication), they are essential in micro and nanotechnology production1.

Carla Frege, TOFWERK, Switzerland. Image Credit: TOFWERK
Therefore, it is clear that cleanroom airborne molecular contaminant (AMC) monitoring is of the utmost importance.
The need for an exemplary degree of cleanliness within the semiconductor industry has, over the years, produced the classification of cleanrooms by the ISO 14644-1 standards, in classes that, according to the number and size of particles permitted per volume of air, range from ISO 1 to ISO 9.
It, therefore, becomes critical to ensure high production rates and yields by measuring airborne particle precursors.
Experimental Set Up
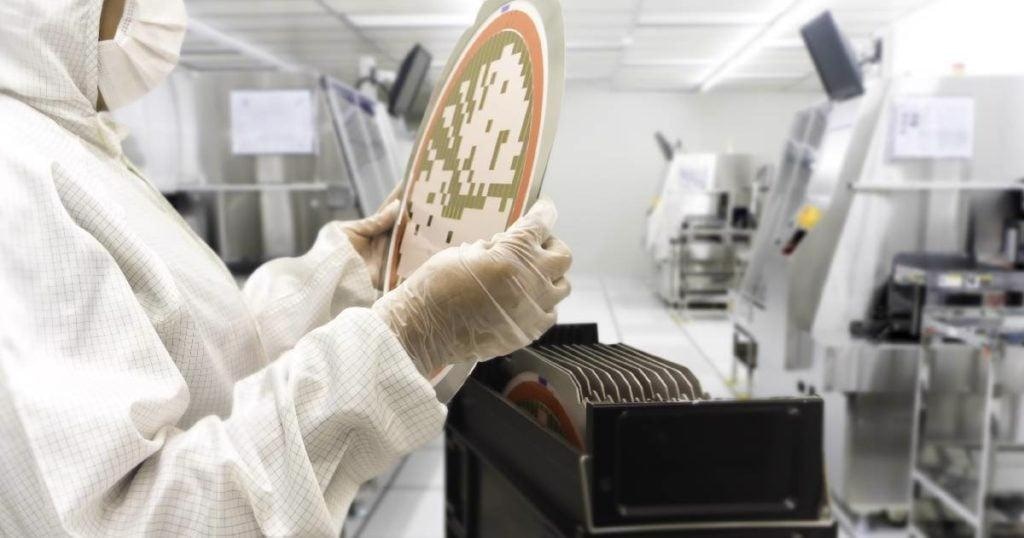
In a microtechnology facility, a Vocus CI-TOF was used for monitoring two cleanrooms: ISO 6 and ISO 8. Air samples were taken from two different points in each cleanroom, to make a total of four sampling points as shown by Figure 1.

Figure 1. Schematic of sampling points in two cleanrooms. Points A and B were located in cleanroom 1 (ISO 8) while points C and D in cleanroom 2 (ISO 6). Image Credit: TOFWERK
Cleanroom AMC Monitoring Results
Immediate assessment of the air quality in each sampling point is facilitated by the rapid response time of the Vocus CI-TOF. This, therefore, means that process failure detection or detection of potential sources of contamination can be performed in mere seconds and with spatial accuracy.
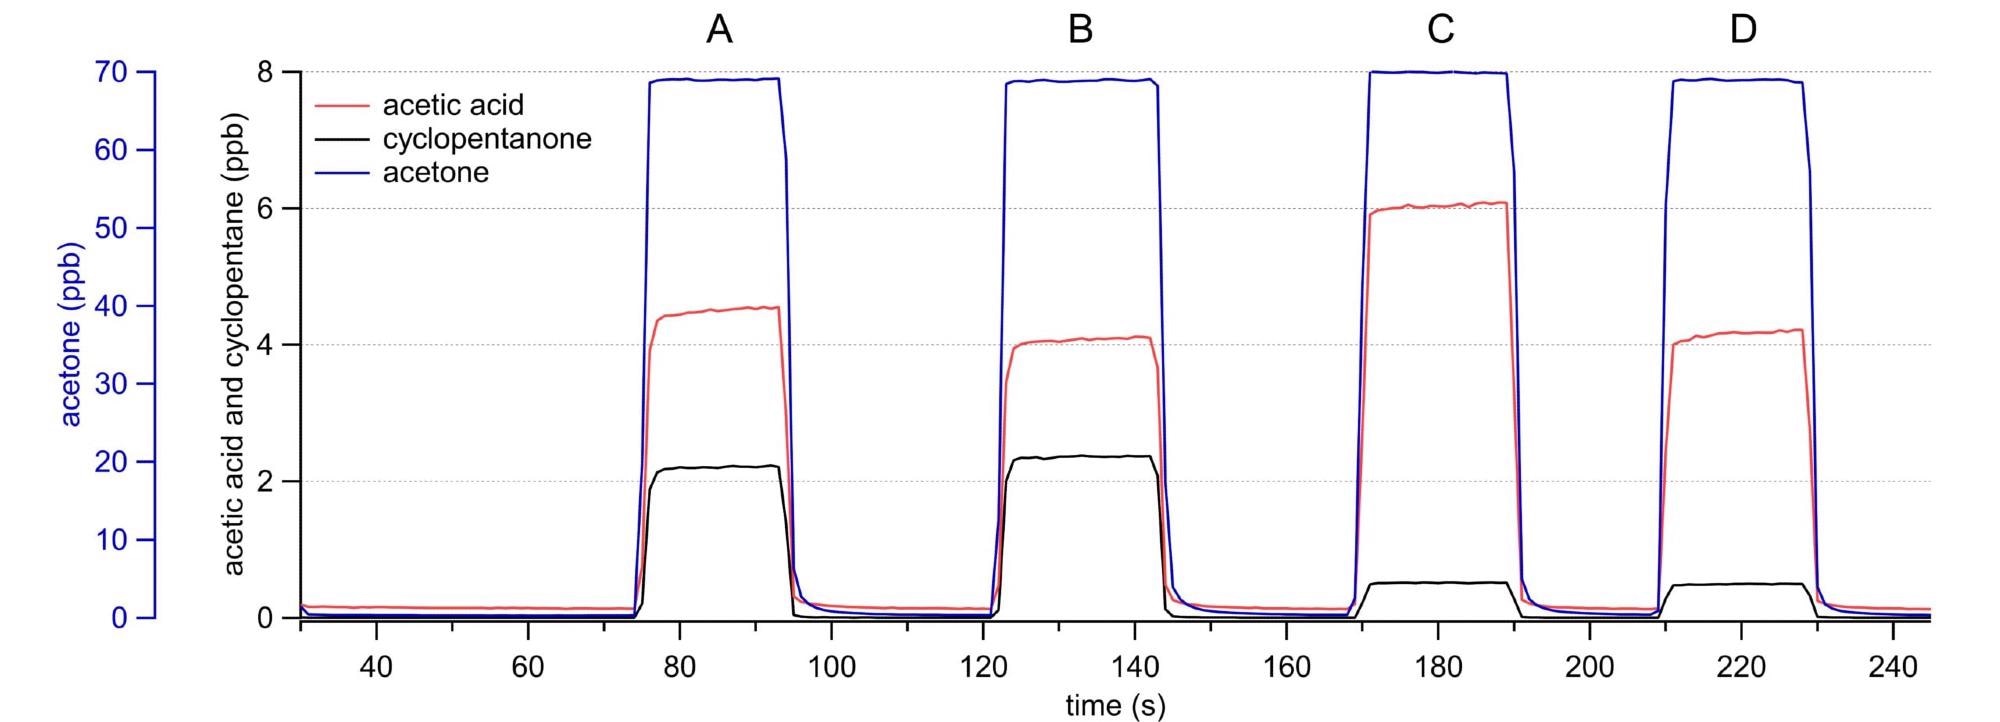
As is shown in Figure 2, the concentration of acetone, acetic acid and cyclopentanone is depicted in four sampling points in two clean rooms (as underlined in Figure 1). In all sampling points, the acetone concentration was found to be constant, while cyclopentane highlighted a difference in concentration across cleanrooms: higher concentrations were found in cleanroom 1, consistent with its ISO 8 class.
A difference is shown by the acetic acid concentration not only between rooms but also sampling points, indicating that there are differences in ventilation or processes within the cleanroom area.

Figure 2. Sampling in each point from the cleanrooms. The trends in concentration of cyclopentanone (black) show a clear difference between the two cleanrooms while acetic acid (red) shows slight concentration differences in the location inside each clean room; finally acetone (blue) had a constant concentration independently of the sampling point. Image Credit: TOFWERK
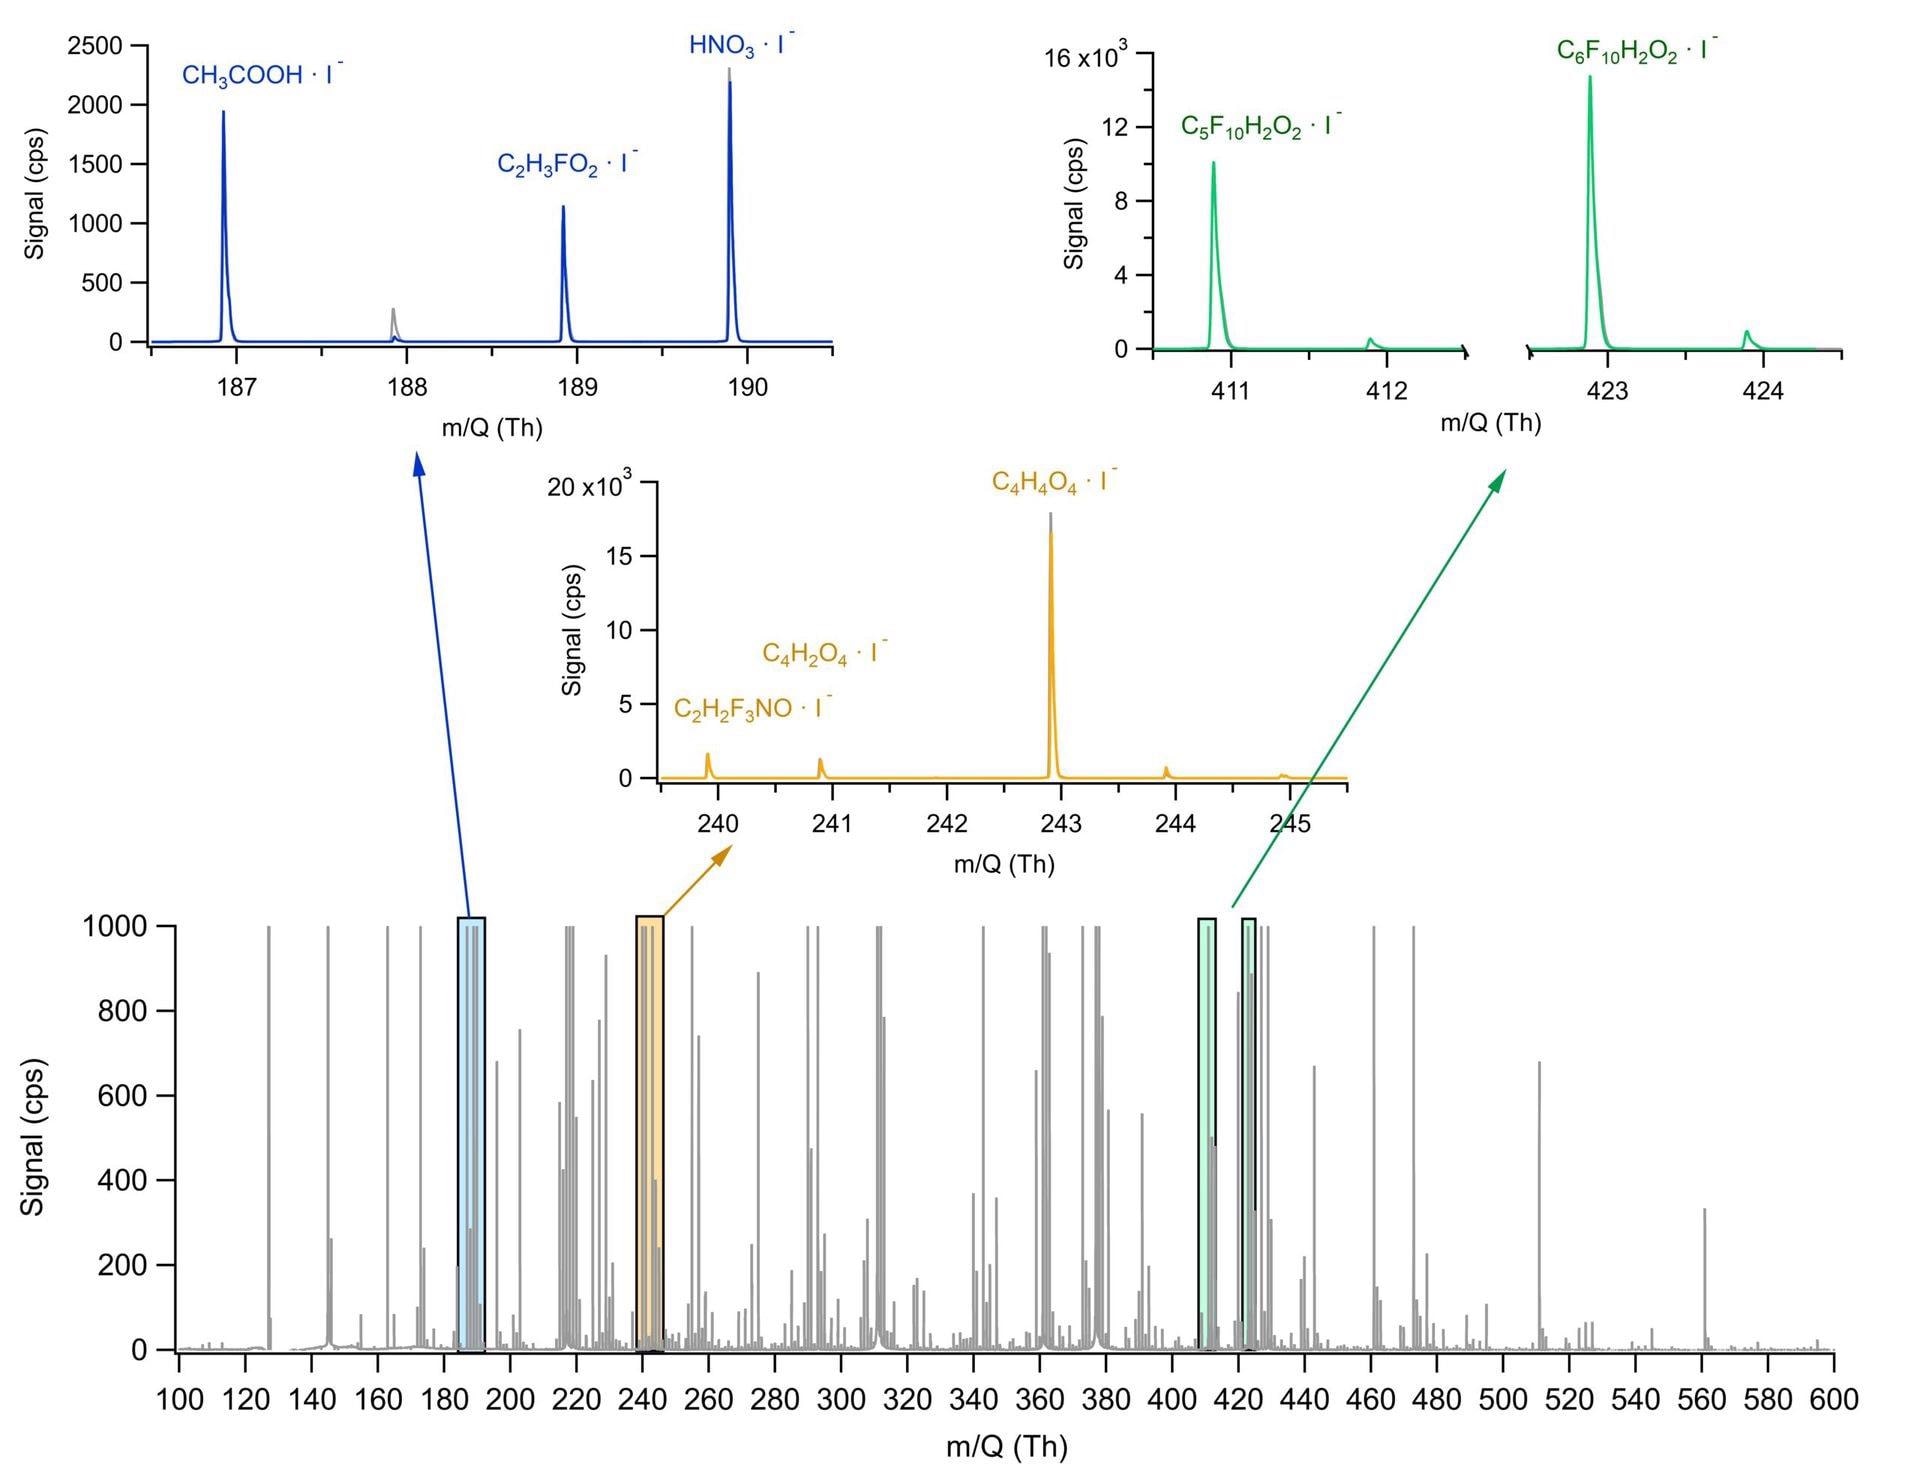
Monitoring different categories of AMCs simultaneously is facilitated by the high versatility and sensitivity of the Vocus CI-TOF. As is shown in Figure 3, the spectrum captured in sampling point B is displayed with some molecules that exemplified the detection.

Figure 3. Spectrum from sampling point B. Examples of molecules found in the low (blue), middle (orange) and high (green) mass range. Tentatively assigned molecules: acetic acid (CH3COOH), fluoroacetaldehyde (C2H3FO2), nitric acid (HNO3), trifluoroacetamide (C2H2F3NO), acetylanedicarboxylic acid (C4H2O4), maleic acid (C4H4O4), Per- and polyfluoroalkyl substances, PFAS (C5F10H2O2 and C6H10H2O2). Image Credit: TOFWERK
References
- Den et.al., Journal of The Electrochemical Society 153(2):G149-G159, 2005, DOI:10.1149/1.2147286

This information has been sourced, reviewed and adapted from materials provided by TOFWERK.
For more information on this source, please visit TOFWERK.