An example of a correlative study between XRM and FIB-SEM has been presented in an earlier study.1 This article will expand the correlation one step beneath the length scale to link FIB-SEM and TEM, characterizing from the device level to atomic resolution.
Autocatalysts have been used since the 1970s, even before the nanoscience revolution.2 At the time of the nanoscience revolution, there was a focus on autocatalyst design via research into Platinum Group Metal (PGM) nanoparticles that were originally utilized in the 70s to help regulate nanoparticle size and composition.
Initiating particular ingredients such as ceria-zirconia has made catalysts highly flexible for various fuel-to-air ratios experienced in combustion engines. There is a particular reason why the autocatalysis process must be characterized at several length scales. However, eventually, it is necessary to do this at the atomic level both in a structural and compositional manner.
An earlier white paper used the device-level characterization of catalyst coating on monoliths. It was observed that characterizing micron-sized porosity may be vital to the transport of gases via the autocatalysts.1
However, if researchers need to exceed the device scale level characterization, it is necessary to characterize FIBs and TEMs.
FIBs could be utilized through an image-cut-image (serial sectioning) routine over a volume tracked by reconstructing this volume from the images into a tomogram.
A high voxel resolution has been obtained using SEM imaging methods, such as backscatter and low voltage Inlens secondary imaging. The STEM tomography method cuts an electron transparent transmission electron microscopy sample with a thickness between 50-100 nm and performs a tilt series acquisition of this volume.
The higher resolution of TEM is balanced with a missing wedge during tilting that draws a line to resolution. The TEM route is harder and would only be utilized if the resolution of the FIB tomography routine is not satisfactory for the type of characterization needed.
One of the benefits of the ZEISS Crossbeam is that the Inlens secondary and Inlens backscattered images can be gathered at high resolution, which would be more than sufficient to characterize porosity at the 5-nm scale approaching standard STEM tomography performance.3
The reconstructions of the TEM tilt series are highly complex due to the missing wedge artifact and distortions in reconstruction routines and measurements of sizes of features. This leads to data skewing, which is why FIB tomography reconstruction has been favored at this length scale.
TEM excels in the sub-nanometer characterization of the nanoparticles. Furthermore, TEM enables atomic-level compositional characterization and subsequent high spectral resolution imaging of oxidation state mapping of areas as part of additional higher-level analyses.
This article examines a research-grade “gasoline particulate filter” (GPF) to determine how analysis at a smaller length scale would combine with analysis that has been performed earlier.
The quality of a site-specific TEM lamella, examined in this study, determines the quality of the additional analysis performed in the TEM. FIB tomography reconstructions are shown in Figure 1.

Figure 1. FIB-SEM scan selected from an XRM overview scan using ZEISS Atlas 5 software. The FIB tomography was performed on a FIB-SEM region of interest with ZEISS Crossbeam 550 at 10 nm (x,y) and 20 nm (z) pixel size. A series of images from the region of interest were stitched and curtaining removal was added for final segmentation. This analysis was propagated to all the frames. Image Credit: Carl Zeiss Raw Materials
FIB-SEM/TEM Analysis
As a consequence of the analysis performed from the segmented image, the green areas are alumina, the pink regions of the washcoat are ceria-zirconia, and all other colors are linked to the rest of the monolith. The research-grade GPF sample displays a 76% ceria-zirconia and a 24% alumina composition.
We can examine this set further and segment it in 3D following the reconstructions to disclose the porosity content for each of the phases inside the structure. Utilizing ZEISS Atlas 5, this reconstruction has been displayed in Figure 2 with several EDX maps while the sample was taken via FIB tomography.
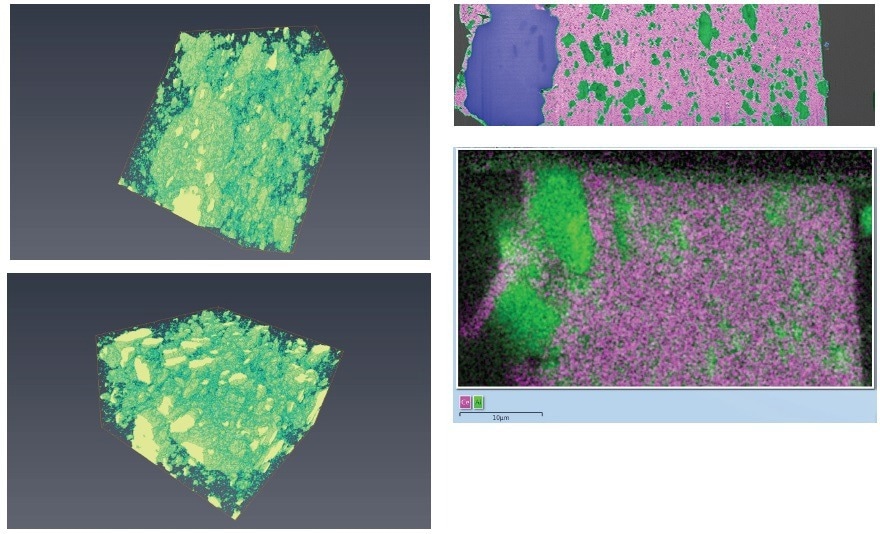
Figure 2. 3D reconstruction and segmentation showing images from two different directions. The EDX analysis reveals the components that form the volume. These volume elements can be analyzed further to reveal nano-porosity in each of the ceria-zirconia and alumina components. Image Credit: Carl Zeiss Raw Materials
The segmentation shows that porosity in the ceria-zirconia component is coarser than in alumina. In this case, EDX data has been obtained every 200 nm, benefiting from the True-Z feature in Atlas 5 3D. True-Z is a patented method that uses a pair of angled lines milled into the defensive deposition pad on top of the volume of interest.
Such lines appear as notches in the cross-section view (see Figure 3). Quantifying the distance between such notches as they move towards each other with the elimination of the slices enables researchers to accurately identify the slice thickness and the sample drift.

Figure 3. FIB-based TEM lamella extracted using in situ lift-out technique, the sample was imaged at different magnifications and various elements were mapped using EDX detector (green=Al, magenta=Ce, and blue=Pd). Image Credit: Carl Zeiss Raw Materials
This data helps to adjust the FIB milling advance in a closed loop. Therefore, True-Z allows much more precise and homogeneous FIB tomography runs and a proper reconstruction of the analytical maps and obtained images.
The reconstruction of this EDX dataset is possible. However, it does not disclose additional data other than to verify that there are no other elements and phases present and that the ratios of ceria to zirconia are as anticipated.
EDX maps present in a FIB-SEM are a great way to verify the elemental composition of several components. However, it is available with restricted spatial resolution due to the larger X-Ray interaction volume in the SEM sample.
The best way to differentiate the different components in 3D is via backscattered images as soon as several intensities of components have been indexed to particular phases with the help of EDX.
It is possible to determine numerous components, which could be thresholded with the help of the backscattered intensity, exhibiting a much higher resolution. This method works remarkably in the ZEISS FIB-SEM due to the integration of EDX detectors while performing FIB tomography and the integration of low-voltage Inlens imaging.
This method is unlikely to function in systems where the sample consists of several complicated phases and elements with small atomic number differences. In such cases, it would be better to make the most of the EDX signal utilizing low kV in the FIB-SEM or make a TEM sample and examine it at a much greater spatial resolution.
The power of the FIB-SEM analysis is that if the components are practically straightforward to determine, it is much easier to perform 3D analysis depending on a tomography dataset and backscattered contrast.
Even if the features seem to be very small, measuring nearly 5 to 10 nm, it would be possible to image these using routines that utilize smaller volumes with smaller slicing currents.
Aligning acquisitions would be a longer and more complex process. However, the images would have greater pixel resolution.
The next level of resolution enhancement has been obtained by pulling out a TEM lamella with the help of FIB-SEM in situ and utilizing this in the TEM to examine the needed features. Figure 3 displays a TEM lamella from a wash coat part of the sample.
The lamella was thinned gradually for various thicknesses to simplify the TEM analysis. The column of images on the left demonstrates how the lamella has been achieved in the FIB-SEM. The image in the middle of Figure 3 uses an atomic number (Z), a sensitive high-angle annular dark field image tracked by a figure on the right where a micrograph and EDX map of the same area is displayed.
The EDX map in the TEM is of greater resolution than the one shown in Figure 2. It is obtained from an interface area where ceria or zirconia joins alumina. It is essential to observe that the Pd particles present were also detected. Pd particles are known to be the active ingredient in this case, the site where catalysis occurs in an exhaust.
The size of these particles is highly significant as they identify the surface area available for catalysis. This shows that better resolution has been obtained in the TEM as the X-Rays develop from a thin slice where the interaction volume seems physically restricted by the lamella thickness, decreasing the addressable volume compared to the SEM.
Atomic Resolution Analysis
It is the atomic structure and uniformity that identifies the performance of a catalyst. This analysis is only beneficial if it is examined as part of a bigger structure. To execute imaging with atomic resolution, the quality of the sample is crucial. The FIB preparation should restrict the amorphous layer caused by FIB preparation.
In this context, high-resolution, aberration-corrected imaging of the FIB slice has been performed, particularly for the ceria-zirconia component.
This component is a significant part of the catalyst structure, helping to identify the oxygen availability for catalysis progression. This component serves as an oxygen regulator inside the structure. Significantly, the structure and composition must be uniform.
Figure 4 displays images of increasing magnification for ceria-zirconia particles, ranging from 10-20 nm. Also displayed below is the atomic resolution image, including the EELS maps for zirconium, oxygen, and cerium.

Figure 4. High magnification snapshot of the FIB sample with increasing magnification up to atomically resolved CeZr columns with simultaneous EELS mapping. Image Credit: Carl Zeiss Raw Materials
It is challenging to obtain compositional characterization at this level of resolution if the sample is not pristine. It shows that the compositional and structural mixing of Ce and Zr are at a perfectly uniform level, the structure is fully stoichiometric, and there are no Ce or Zr-rich areas. This is what is anticipated from this component for it to function at the optimum level.
This describes the method needed to describe catalysts from the FIB-SEM resolution limit to atomic-level characterization. It is essential to be able to do this after a systematic analysis routine obtaining the data and analyses in the quickest possible way to support catalyst development measures.
TEM imaging and EDX maps disclose various essential aspects regarding materials analysis. However, examining a random area raises statistical significance issues as the volume examined is a very small part of the material.
Examining an area that has been predetermined is essential as it reveals the bigger picture of the structure and completes a loop in the statistical investigation of a system. ZEISS examines parts where it can view appropriate features that regulate the material’s properties.
Conclusions
Examining autocatalysts at the nanometer to atomic scale is a crucial part of the characterization of such materials.
The atomic surfaces and particle size where the catalysis will occur must be improved so that the catalyst functions most beneficially to decrease air pollution by purifying noxious gases from car exhausts.
The analysis illustrated in this context finishes the analysis cycle needed to obtain this highly optimum structure and composition. ZEISS Xradia X-ray microscopes and ZEISS Crossbeam FIB-SEM instruments play a crucial role.
It is vital to comprehend materials utilizing site-specific analysis driven to obtain statistical importance of the data, and it helps the development of improved catalysts for a greener world.
References
- https://zeiss.widen.net/s/csfjgd1bbf/en_wp_correlative_xrm_fib_sem_autocatalyst
- Twigg. M. (1999) Twenty-Five Years of Autocatalysts. Platinum Metals Rev., 43, (4), 168-171
- https://blogs.zeiss.com/microscopy/en/zeiss-crossbeam-550-sets-new-standards-in-3d-analytics-and-sample-preparation/
- https://www.zeiss.com/microscopy/en/service-support/upgrades/xradia-versa.html

This information has been sourced, reviewed and adapted from materials provided by Carl Zeiss Raw Materials.
For more information on this source, please visit Carl Zeiss Raw Materials.