Sponsored by m-oemReviewed by Olivia FrostMay 11 2023
Due to the COVID-19 pandemic in 2020, the demand for hand sanitizer experienced an unprecedented surge. Many companies streamlined their operations to produce hand sanitizer in large quantities to meet this increased demand.

Image Credit: ShutterStock/Maridav
The accurate formulation ensures good quality and minimizes waste in any product manufacturing process, including hand sanitizer.
For hand sanitizers to be effective antiseptics, the alcohol content must exceed 60% (v/v). The commonly used reagents in these solutions include water, alcohol (ethanol or isopropanol), small amounts of emollient (such as glycerol), and an oxidizing agent (e.g. hydrogen peroxide) to reduce microbial contamination.
Reagent-free near-infrared spectroscopy is a safe and rapid method to monitor the ethanol content in hand-sanitizing solutions. This technique provides reliable results in seconds, enabling timely adjustments to the formulation when necessary.
Experimental Equipment
A range of ethanol content, from 58% to 82% (v/v), was present in ethanol/water standards mixtures. The total wavelength range (400–2500 nm) was utilized to measure these mixtures in transmission mode with a DS2500 Liquid Analyzer.
Reproducible spectrum acquisition was achieved by implementing the built-in temperature control, set at 40 °C.
Disposable vials with a path length of 8 mm were employed for convenience, which obviated the need for cleaning the sample vessels. All data acquisition and prediction model development was performed using the Metrohm software package Vision Air Complete.

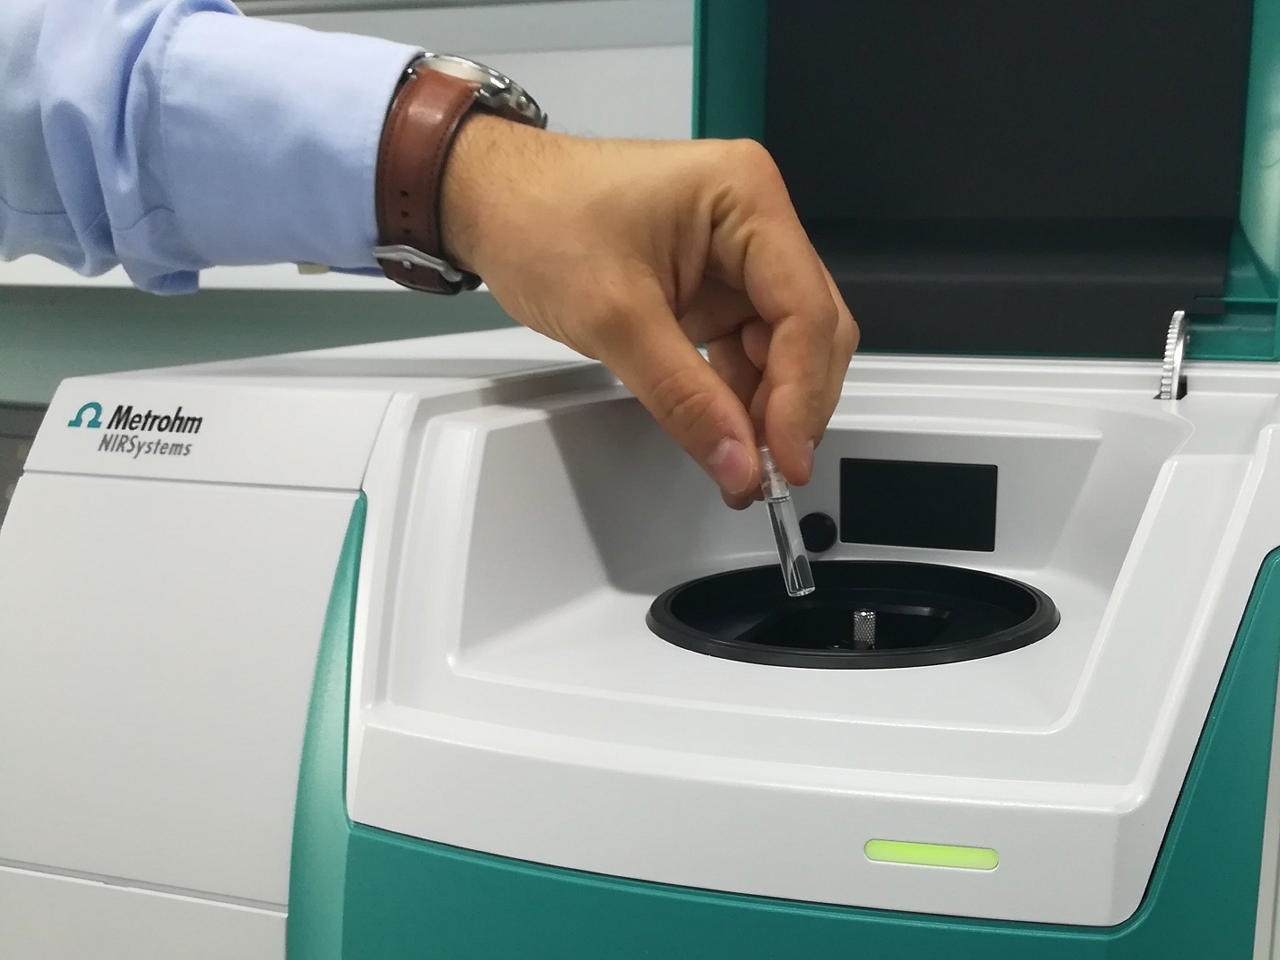
Figure 1. DS2500 Liquid Analyzer and a sample filled in a disposable vial. Image Credit: B&W Tek
Table 1. Hardware and software equipment overview. Source: B&W Tek
| Equipment |
Metrohm number |
| DS2500 Liquid Analyzer |
2.929.0010 |
| DS2500 Holder 8 mm vials |
6.7492.020 |
| Disposable vials, 8 mm |
6.7402.000 |
| Vision Air 2.0 Complete |
6.6072.208 |
Results
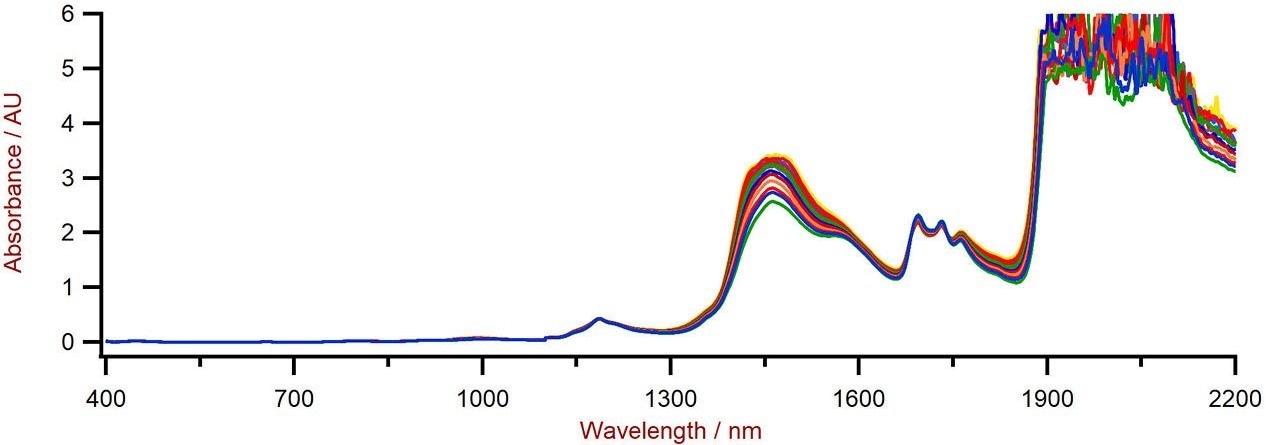
The 13 Vis-NIR spectra (Figure 2) generated a prediction model for quantifying the ethanol content.
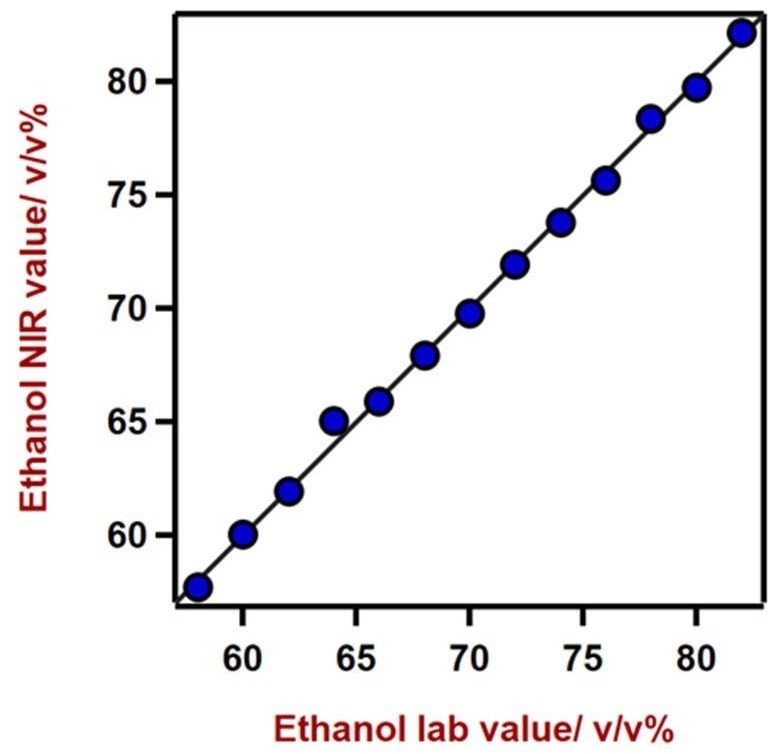
The quality of the prediction models was assessed using correlation diagrams, which demonstrated a remarkably high correlation between VisNIR prediction and primary method values. The figures of merit (FOM) depict the anticipated precision of a prediction during routine analysis.

Figure 2. Vis-NIR spectra of hand sanitizers with varying ethanol content measured on a DS2500 Liquid Analyzer. Image Credit: B&W Tek

Figure 3. Correlation diagram and the respective figures of merit for the prediction of ethanol content in hand sanitizers using a DS2500
Liquid Analyzer. Image Credit: B&W Tek
Table 2. Figures of merit for the prediction of ethanol content in hand sanitizers using a DS2500 Liquid Analyzer. Source: B&W Tek
| Figures of merit |
Value |
| R2 |
0.9977 |
| Standard error of calibration |
0.41 v/v% |
| Standard error of cross-validation |
0.56 v/v% |
Conclusion
The feasibility of employing the DS2500 Liquid Analyzer to determine ethanol in hand sanitizer products is exemplified in this article. Vis-NIR spectroscopy permits a rapid determination with exceptional precision, offering a viable substitute to the conventional method.
Table 3. Time to result for the ethanol content determination in hand sanitizers using gas chromatography. Source: B&W Tek
| Parameter |
Method |
Time to result and workflow |
| Ethanol content |
GC |
5 min (preparation) + 5 min (GC) |

This information has been sourced, reviewed and adapted from materials provided by B&W Tek.
For more information on this source, please visit B&W Tek.