Restorative dentistry aims to bring damaged dentition back to acceptable functional and aesthetic levels (see Figure 1).
Composite materials for dental fillings are replacing amalgam alloys due to their aesthetic aspects, biocompatibility, and non-toxicity, as well as their lack of pollution by mercury waste.
However, the lifetime of composite fillings is limited, and secondary caries, filling fractures, or filling loss can arise.

Figure 1. Restorative dentistry examples, showing (a) ceramic inlays; (b) amalgam restoration; (c) composite fillings. Image Credit: Bruker Nano Surfaces
Mechanisms, including occlusal loading and composite shrinkage associated with the polymerization process in UV light, create stresses in both adhesive and filling layers. This results in failures of the tooth-restoration interface, which weakens marginal integrity.
The application of UV light from the top of the filling initiates the polymerization process at the surface, and this continues to a depth below the surface. This challenge of restoration failures could be overcome via the minimization of interfacial stress by optimizing the dental restoration method, as well as the cavity shape.
Determining the relationship between polymerization depth and mechanical properties may help to optimize layered restorations.
Meanwhile, determining the relationship between mechanical properties and aging, which are related to chemical processes and internal stresses, allows for the optimization of the cavity shape, as well as extending the lifetime of the restoration and enhancing its performance.
This article outlines an investigation into the aging of composites by measuring the evolution in elastic modulus as a function of time following polymerization. Three distinct dental filling composites were evaluated, each with a different chemical composition and microstructure of filler particles.
This article also considers how nanomechanical studies can be employed to establish the depth of polymerization by measuring the mechanical properties within the cross-section of a polymerized sample, in addition to understanding how mechanical properties change over time.
Experimental Procedure
A Hysitron TriboIndenter nanomechanical test instrument was employed to carry out nanoindentation experiments on dental composites. Cylindrical holes were drilled into an epoxy resin and subsequently filled with the composite. This was followed by the application of UV light from the top to cure the filling (halogen lamp, λ=465 nm).
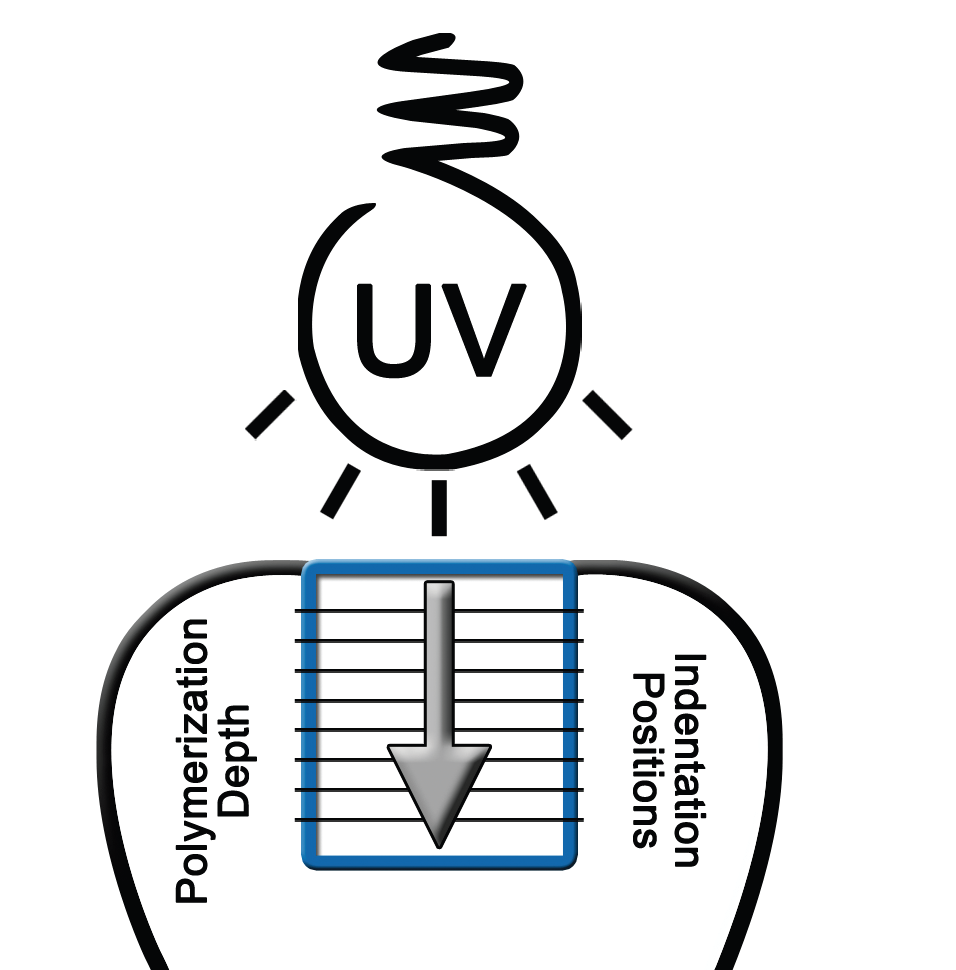
The filled holes were cross-sectioned and polished. Nanoindentation measurements were conducted over the cross-section at increasing distances from the irradiated surface, as displayed in Figure 2.

Figure 2. Schematic showing the procedure used in testing the dental restorative composites. Image Credit: Bruker Nano Surfaces
A diamond Berkovich probe was used to conduct load-controlled quasi-static nanoindentation tests on the samples. These tests followed a trapezoidal loading function and involved 5 seconds of loading, 10 seconds of constant force hold segment, and 5 seconds of unloading.
An indentation matrix of 3x7, with 15 microns between indents, was positioned at intervals of 0.5 millimeters to a final depth of 3.5 millimeters below the cross-section’s irradiated surface.
To examine the impact of aging following polymerization on elastic modulus, nanoindentation tests were performed at four different intervals: 1 hour, 1 day, 1 week, and 1 month following the specimen being subjected to UV light.
To replicate real-world conditions, specimens were stored in the dark and immersed in a physiological solution at 37°C.
Results
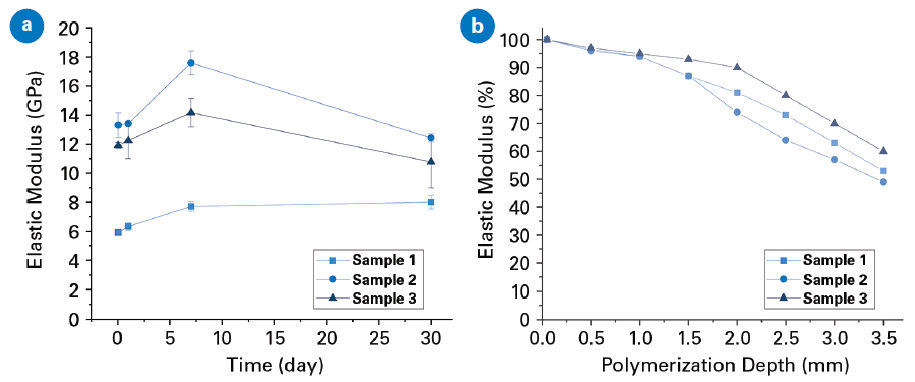
The results from both the depth profile and aging studies for all three samples of dental composites are presented in Figure 3a and Figure 3b, respectively.
Each tested material exhibited a significant increase in modulus at the end of the first week, with Sample 1 increasing from 11.9±0.2 gigapascals to 14.2±0.9 gigapascals, Sample 2 increasing from 13.1±0.8 gigapascals to 17.6±0.8 gigapascals, and lastly, Sample 3 increasing from 5.8±0.2 gigapascals to 7.8±0.3 gigapascals.
A decrease of modulus was observed for Sample 1 and Sample 2 following one month, with Sample 1 decreasing to 10.8±1.7 gigapascals, and Sample 2 to 12.5±0.3 gigapascals.
The modulus of Sample 3 stayed practically unchanged, with a statistically non-significant increase. The results demonstrate that the elastic modulus of dental composites varies significantly with time.
Figure 3b shows a dependence of elastic modulus on the depth of UV light absorption. All three samples reached 50-60% of the maximum value at a depth of 3.5 millimeters.

Figure 3. (a) Elastic moduli of the resin composite tested at different time periods after the polymerization; (b) Percent of maximum elastic modulus as a function of polymerization depth achieved by UV curing. Image Credit: Bruker Nano Surfaces and Metrology
Conclusions
Results imply that aging time significantly impacts the development of the elastic modulus of the restoration composites. These variations can are thought o be a result of the setting reaction between the filling particles and polymer matrix following polymerization.
The modulus of elasticity is reliant on the curing light intensity, i.e., on the depth of light absorbance. A minimal decrease of modulus is seen for the depth up to 1.5 millimeters, whereas a more significant decrease is observed for the depth range from 1.5 to 3.5 millimeters.
The polymerization depth that is ensured by the producer can be confirmed by the acquired results. Moreover, layered restoration can be optimized to increase the stiffness of the whole filling, as well as the shape of the cavity.
Acknowledgments
Produced from materials originally authored by Jaroslav Lukeš at Bruker Nano Surfaces and Metrology.
References
- Eichlerova, R., Lukes, J., Konvickova, S., Bradna, P. Chem. 104, s307 (2010).
- Eichlerova, R., Lukes, Sepitka, J., Konvickova, S. Chem. 105, s794 (2011).
- Eichlerova, R., Lukes, Sepitka, J. Computer Methods in Biomechanics 14, 261 (2011).

This information has been sourced, reviewed and adapted from materials provided by Bruker Nano Surfaces and Metrology.
For more information on this source, please visit Bruker Nano Surfaces.