Sorbent materials, which can take up and reversibly store gases and vapours, have a lot of potential to alleviate challenges in energy efficiency, climate change, and sustainability.1 They offer promising solutions to achieve decarbonization targets that will allow humanity to attain net carbon neutrality and prevent the accumulation of greenhouse gases such as CO2.

Image Credit: ShutterStock/mykhailo pavlenko
Characterizing promising materials for these applications is often challenging, given that most experimental studies rely exclusively on pure equilibrium isotherms rather than actual process compositions and conditions.
Actual flue gas or ambient air mixtures found in post-combustion and direct air capture conditions, respectively, contain a notable amount of H2O and other compounds such as SO2 and NOX. These compounds all compete with CO2 for the adsorbent active sites.
It is paramount to study the reusability, regeneration, and cyclability of these materials, along with the detailed kinetics of the capture process.
Gravimetric, Chromatographic and Volumetric methods are traditionally used to perform advanced sorption experiments. These techniques can be applied under different conditions of temperature and pressure. Equipment configuration, specific application and experimental design would determine the environmental conditions needed of temperature and pressure as well as either ambient flow or vacuum using mixtures or pure components.
Common Measurement Methodology
a) Gravimetric Methods
The change in weight resulting from adsorption in a gravimetric method is directly measured by using a highly sensitive microbalance. The net force can be equated to uptake either directly or with a buoyancy correction. In a wide range of conditions, gravimetric measurements are some of the most accurate means of measuring uptakes of gases and vapors.
A widely known benefit of gravimetric methods is that they typically require a low amount of sample: as little as 1 mg can be used to obtain reliable results for single-component measurements.
An additional benefit of gravimetric systems is their versatility in operating across dynamic and static modes, as well as under varying atmospheric pressures including low, high, and ambient conditions. However, materials displaying strong interactions with their environment and undergoing weight fluctuations due to chemical reactions might pose challenges when examined through these techniques.
Surface Measurement Systems range of Gravimetric sorption analysers were developed to address most industrial needs and offers a wide variety of configurations dependant on the application. For more information, check the Dynamic Vapor Sorption analysers instruments here.
b) Chromatographic or Break Through Method
A known gas mixture is passed through a fixed bed or material in a breakthrough analysis (BTA) method, and the concentration is monitored at the end of a packed adsorbent column.
Equilibrium, bed transport and kinetic information is provided by the shape of the resulting breakthrough curve. The breakthrough analysis method can determine true multicomponent adsorption data, e.g., individual uptakes of two or more components in a mixture.
The BTA Frontier system is Surface Measurement System's flagship breakthrough instrument. It consists of three main sections: generation, bed, and detection. The desired mix of gases is prepared at a constant flow rate in the generation section: CO2, H2O, and/or volatile organic compounds (VOCs) are feasible in a carrier gas (e.g. N2).
The gas mixture then enters an adsorbent packed column, previously activated in-situ. A suite of independent detectors monitors each gas's concentration profile at the column's exit.
Another relevant Chromatographic method employed by SMS is Inverse Gas Chromatography. Being a gas-phase sorption technique with a highly advanced injection system, it elucidates detailed information about surface energetics of the adsorbent material. Understanding and tuning the material surface properties during their development stage is crucial to assure their optimum gas capture performance.
C) Volumetric Methods
A cell containing the adsorbent material is dosed sequentially from a known volume of gas in volumetric methods. The pressure change is the parameter measured directly in a volumetric system, which is then converted to uptake using an equation of state. Volumetric methods are one of the most widely used and popular in the industry. They require less sophisticated equipment and are applicable for a wide variety of highly porous materials.
Gas or vapor pressure measurements are not as sensitive or accurate as weight change due to this indirect measurement nature. Additionally, volumetric approaches often demand larger sample sizes to achieve comparable sensitivity, leading to extended durations for sorption equilibrium attainment. These circumstances could significantly increase experimental expenses in situations involving expensive, hard-to-synthetize, or pharmaceutical samples.
By definition, the volumetric method is a static process facing particular difficulty in equilibration at low pressures. It must also be noted that after the first dose, each subsequent dose propagates errors in previous doses. This uncertainty means that the uncertainty range after tens of points can become more significant than the uptake itself.
Surface Measurement Systems does not offer volumetric systems within its portfolio, as most of the applications are covered within their Gravimetric and Breakthrough analyser.
A static or equilibration mode is used to conduct traditional sorption measurements. The gas is dosed into a sample chamber that contains the sorbent in this process. The chamber is sealed and the pressure is equilibrated.
The method is ideally suited to adsorbates with fast kinetics (e.g., N2 but not H2O). The fact that measurement errors compound with each dose is the primary limitation of static measurements. The system pressure can change for various reasons besides adsorption during the experimental period, commonly attributable to vacuum leaks or temperature changes. This may result in errors in measurements, especially at low partial pressures.
Dynamic Mode
Both the upstream rates of entry and the downstream exit rate are controlled by the method, which effectively controls the flow rate and the total pressure/concentration of the adsorbate in the chamber.
Dynamic methods offer certain benefits over static methods, including increased sorption kinetics from directed flows over the adsorbent and better protection.
Possible configurations with SMS instrumentations
|
|
Static Mode
|
Dynamic mode
|
Low pressures
|
Atmospheric
|
High Pressure
|
|
Gravimetric
|
X
|
X
|
X
|
X
|
|
|
Breakthrough
|
X
|
X
|
-
|
X
|
-
|
|
Volumetric
|
-
|
-
|
-
|
-
|
-
|
In this article we’ll showcase some of the common applications for single and binary mixtures with SMS Instrumentation.
Pure Component Isotherms
The first step in characterizing a porous material is pure component isotherms: assessing the uptake of the component(s) of interest as a function of pressure. The material's potential to be competitive for the target application compared to other benchmark materials is indicated by this step.
Key performance indicators such as working capacity, capacity, kinetics and enthalpy of adsorption can be determined from the isotherms.
a) Gravimetric CO2 Sorption on MOFs
Instrumentation used: DVS Vacuum
Mode: Dynamic
Experimental Conditions: Low pressures up to 1 bar and different temperatures
Metal organic frameworks (MOFs) is the name given to crystalline clusters of metal ions connected by organic linkers. High-capacity storage or selective separation of CO2, natural gas, hydrocarbons, hydrogen, and other compounds can be facilitated by their tunable pore sizes and large specific surface areas (up to 5000 m2/g).
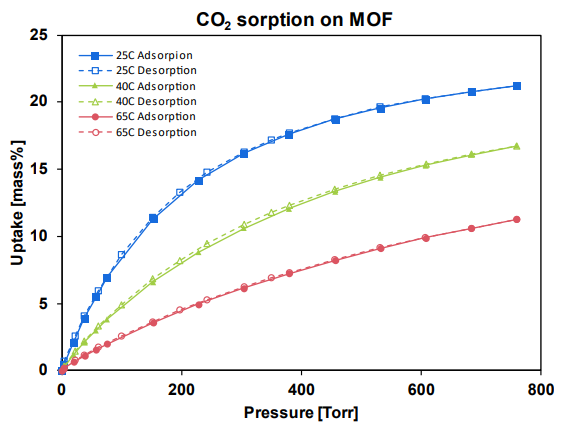
Figure 1. CO2 gas sorption on MOFs.
Image Credit: Surface Measurement Systems Ltd
The pure sorption/desorption isotherms of CO2 on a prototypical MOF at three different temperatures is shown by Figure 1, up to 1 bar (760 tort). As the concentrations in these applications reach 0.04-50% CO2 by volume at atmospheric pressures, this range is highly relevant for point source and direct air capture.
A model, like Langmuir or Sips, can fit the isotherm and obtain fundamental parameters crucial for process modeling, such as simulating beds for PSA or TSA processes.
The isotherms can also determine the enthalpy of adsorption, a parameter representative of the interaction strength of the gas with the adsorbate. Higher interactions indicate better selectivity towards CO2 than other mixture gases.
From a process perspective, the enthalpy of adsorption can be related to the amount of heating in the bed and the amount of energy needed to regenerate the material. Clausius- Clapeyron method implemented in the DVS Advanced Analysis module in Figure 3 is used to calculate the enthalpy of adsorption of the previous MOF.
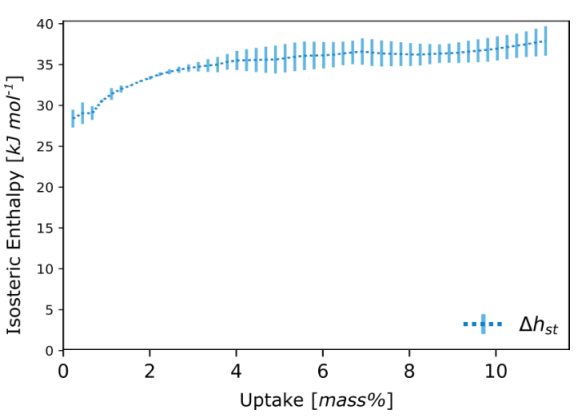
Figure 2. Enthalpy of adsorption of CO2.
Image Credit: Surface Measurement Systems Ltd
b) SO2 Sorption on Zeolites at 25 °C
Instrumentation used: DVS Vacuum
Mode: Dynamic
Experimental Conditions: Low pressures up to 1 bar and 25°C
SO2 has a high potential for human and environmental toxicity and is a common contaminant in natural gas or flue gas streams. Scrubbing it through highly selective yet still reversible adsorption processes would represent a vital milestone. In parallel, mass- or electrical- sensors enhanced with porous materials can facilitate the detection of SO2 even at ppm/ppb concentrations.2
The sorption of SO2 gas on three different prototypical zeolites is shown in Figure 3. At 25 °C, the sorption behavior was found to be highly variable. The isotherm shape and reversibility are different, though the uptakes at saturation are all between 20% to 35% weight by mass. With more than 15% of SO2 sorption being irreversible under vacuum, Zeolite 5A has the steepest uptake at low pressure.
These qualities would render the material a good candidate for SO2 scrubbing. However, the adsorption on Zeolite H-SDUSY follows a type V isotherm and is nearly reversible. It may be less likely to be poisoned by SO2 if used as a catalyst in an acid stream.
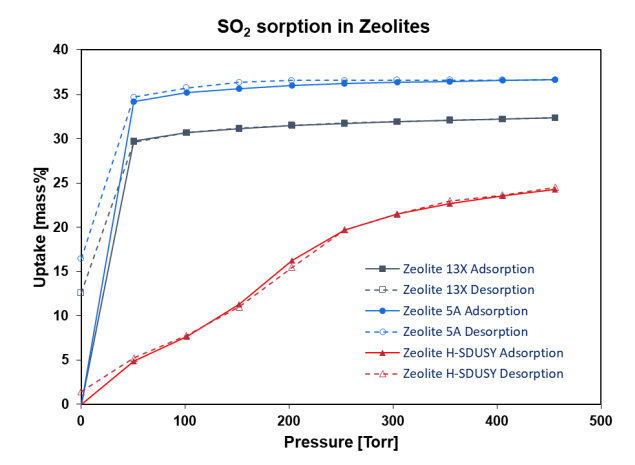
Figure 3. SO2 gas sorption on three prototypical zeolites.
Image Credit: Surface Measurement Systems Ltd
Two-Component Adsorption
Exploring the influence of one component on another offers a new level of information regarding the performance of a material for capture or separation, even though single-component isotherms can be used as a basis for modeling sorption behavior in a two-component system.
Two components can be introduced sequentially or simultaneously using the DVS Vacuum’s dual inlets. In the following examples, these options are explored.
Most direct measurements of co-sorption experiments present the same challenges: one of the most pressing is how to deconvolute or interpret the resulting data.
It is still difficult to determine the proportion of adsorbent absorbed, even when comparing co-sorption data with isotherms measured with each adsorbent exposed in isolation. However, as seen in these studies, co-sorption can be used to indicate a material’s preference to sorption of one species as compared to another.
a) CO2/H2O Binary System in a Static Mode
Instrumentation used: DVS Vacuum
Mode: Static
Experimental Conditions: Low pressures up to 1 bar and 45°C
The two components are introduced sequentially in a static mode. First, the sample can equilibrate under one adsorbate at a desired pressure. A controlled dose of a second adsorbate is subsequently added to the headspace.
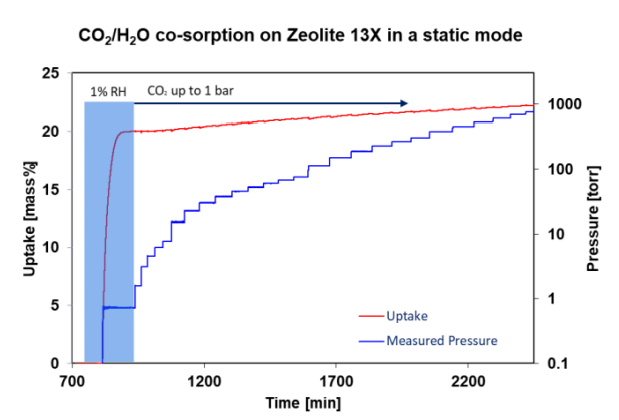
Figure 4. CO2 adsorption on humid Zeolite 13X.
Image Credit: Surface Measurement Systems Ltd
This approach studies the total uptake of CO2 in humid Zeolite 13X at 45 °C. The zeolite was activated for four hours under a 10-5 Torr vacuum at 250 °C. Figure 4, depicting the first step, represents dosing of water vapor at a pressure of 0.73 Torr, or 1% RH. By weight of water, the sample takes up almost 20%. Incrementally, CO2 is dosed up to 1 bar, or 760 torr. The sample takes up a further 2% of mass.
Single-component measurements in the literature show that Zeolite 13X has a H2O capacity of approx. 20 wt% at 1 RH% and a CO2 capacity of around 15 wt% at 1 bar.3 It is shown by the above data that the two components compete for the same adsorption sites, as the total uptake is not the sum of individual components.
b) Gravimetric CO2/H2O Binary System in a Dynamic Mode
Instrumentation used: DVS Vacuum
Mode: Dynamic
Experimental Conditions: Low pressures up to 1 bar and 45°C
Both components are introduced simultaneously in dynamic mode. A target pressure in the headspace will be achieved by the flow of the two components over the sample and the sample equilibrates in mass at various predetermined pressures.
The sorption and co-sorption properties of Zeolite 3A were measured by the DVS Vacuum using a dynamic flow of the adsorbate(s). The zeolite was activated for seven hours under a 10-5 Torr vacuum at 300 °C.
The sorption measurements were then undertaken at 25 °C.
The adsorption and desorption isotherm for CO2 sorption with the uptake measured at 90%, P/P0 being 9.9% of the dry mass, is shown in Figure 5. Figure 5 also depicts the results for co-sorption from a CO2 and H2O flow (~10:1), which show a significant increase in uptake: 24% of the dry mass at 90% P/P0.
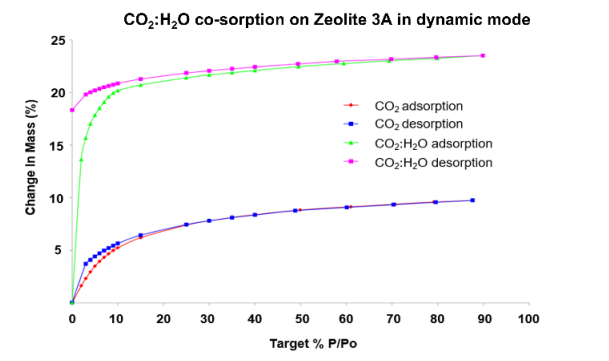
Figure 5. CO2 sorption and Co-adsorption of CO2/water (10:1) sorption on Zeolite 3A.
Image Credit: Surface Measurement Systems Ltd
This material’s selectivity for water sorption over CO2 sorption is demonstrated by the significant increase in uptake in the co-sorption experiment compared to the single-component experiment.
Realistic Process Conditions
Experiments should be performed in realistic process conditions to fully understand the material performance for gas capture or separation, with a close approximation of the gas stream.
For instance, this stream should ideally contain nitrogen, carbon dioxide and water in CO2 capture applications. Cycling studies can evaluate long-term performance in these conditions. BTA and DVS are crucial tools in this endeavor, as evidenced in the following two case studies.
a) Gravimetric Gas Sorption in Realistic Conditions
Instrumentation used: DVS Carbon
Mode: Dynamic
Experimental Conditions: ambient pressures and 25°C
The DVS Carbon system was used to analyze and measure adsorption and co-adsorption of low concentrations of CO2 and H2O on two MOF samples MIL-101(Cr) and a partly functionalized analog MIL-101(Cr)-4F (1%), at ambient pressure and temperature (298 K and 1 bar) respectively, to represent point source capture conditions.4
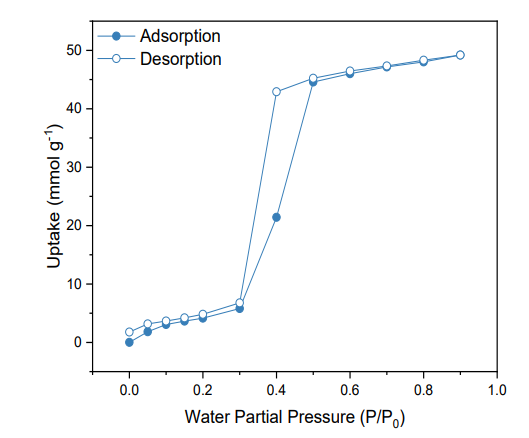
Figure 6. Water adsorption and desorption isotherms of the functionalized material MIL-101(Cr)-4F (1%).
Image Credit: Surface Measurement Systems Ltd
The water adsorption and desorption isotherms of the functionalized material is shown in Figure 6. The isotherms are parallel to slightly hydrophobic mesoporous solids or Type V, where multilayer adsorption is noted at low partial pressures 0 to 0.3, followed by a clear hysteresis loop between 0.3 and 0.6 that is linked with capillary condensation occurring in the mesopores.
49.1 mmol g-1 was the maximum water uptake for the fluorinated MIL-101, which is lower to the uptake reported for the as-received material under the same conditions (55.5 mmol g-1).1 This proves an effective overall hydrophobicity attributed to incorporating fluorine atoms.5
CO2 adsorption isotherms of both materials is depicted in Figure 7. Though at higher partial pressures, the normal MIL- 101(Cr) material shows a slightly higher CO2 uptake, which is very similar up to 0.6 bar. This is attributable to the lower pore volume of fluorinated MIL-101 compared to normal MIL-101(Cr), 1.19 cm3g-1, and 1.32 cm3g-1, respectively.
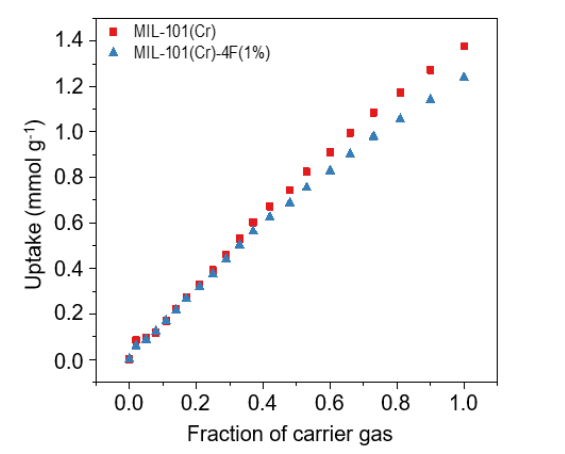
Figure 7. Carbon dioxide (CO2) adsorption isotherms at 298 K and 1 bar of MIL-101(Cr) and MIL-101(Cr)- 4F(1%).
Image Credit: Surface Measurement Systems Ltd
In the DVS Carbon, the effects of low-concentration CO2 sorption and diffusion on both materials were measured under humid conditions. To simulate flue gas composition, samples were exposed to a selected range of partial pressure of water vapor (P/P0 of water of 0, 0.05, 0.1, 0.15 and 0.2) following activation.
A step increase in CO2 concentration to 0.05 bar was introduced while this pressure was held constant, followed by desorption of CO2 and, finally, desorption of water vapor. The data acquired from a typical co-adsorption experiment consists of four steps, two for adsorption and two for desorption (Figure 9).
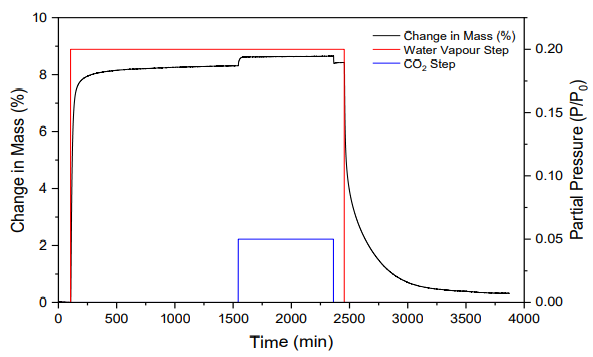
Figure 8. Adsorption and desorption mass change of MIL-101(Cr) exposed to a step change of water partial pressure of 0.2 P/P0, followed by a CO2 partial pressure step change of 0.05 bar at 298 K and 1 bar total pressure.
Image Credit: Surface Measurement Systems Ltd
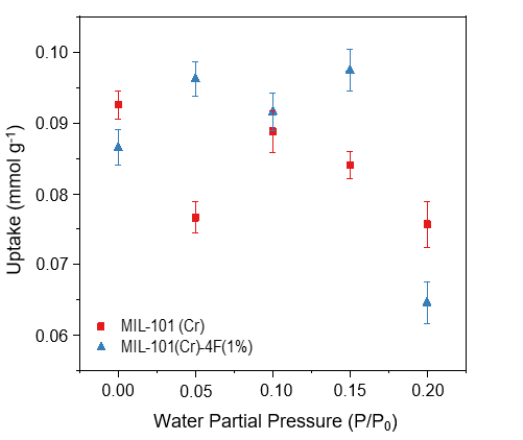
Figure 9. Carbon Dioxide (CO2) adsorption capacities of MIL-101(Cr) and MIL-101(Cr)-4F(1%), CO2 P/P0 = 0.05 at different water partial pressures (0, 0.05, 0.1, 0.15 and 0.2 P/Po) at 298 K and 1 bar.
Image Credit: Surface Measurement Systems Ltd
The CO2 adsorption capacities of both materials at 5% CO2 concentration with different water loadings from 0-0.2 or 0-20% RH are shown in Figure 9. The presence of water is detrimental to the performance of the non-modified MIL-101(Cr).
Up to the highest value studied, at which point its uptake decreases by around 18% compared to the dry material, CO2 capacity decreases with increasing amounts of water vapor. Fluorinated MIL-101, on the other hand, shows a CO2 uptake enhancement at low and moderate water loadings and reaches a maximum uptake of approximately 0.1 mmol g-1 CO2 at a partial pressure of 0.15.
The fluorinated material shows a 22% lower CO2 uptake at the partial pressure of 0.2 compared to the dry material. This could be because some terminal water molecules might be lost during the activation of the material. However, some favored CO2 adsorption sites may be lost due to the complete loss of these water molecules.
Some of these adsorption sites are recovered with increasing RH values, so the uptake improves. There is a value of RH where H2O molecules compete for adsorption sites with CO2, and their presence no longer has a positive effect. This phenomenon has been previously reported for other MOFs such as MIL-100 and UiO-66.
b) BTA in Realistic Conditions
Instrumentation used: BTA Frontier
Mode: Dynamic
Experimental Conditions: ambient pressures and 25°C
Until now, all co-sorption experiments could only indicate the influence of the presence of one component on another. Breakthrough methods are required to fully determine the individual uptakes of multiple components.
A column of shaped Zeolite 13X pellets was prepared, with a total mass of 0.26 g. Designed with small sample amounts in mind, the BTA Frontier enables quick screening of materials for co-sorption conditions.
A mixture of CO2 and H2O and nitrogen carrier totaling of 50 sccm was passed through the column after activation at 250 °C under an inert gas flow at concentrations of 3.5 vol% and 20 RH%, respectively.
Using the integrated BTA sensors, the concentration at the column outlet was monitored, yielding the breakthrough curves in Figure 11. A blank measurement was performed using helium as an inert gas and then subtracted from the curves to remove contributions of dead volume and axial dispersion. With activation between each run, the measurement was repeated in triplicate.
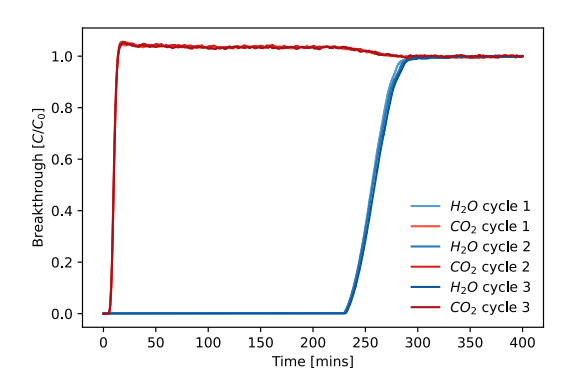
Figure 10. Three repeated breakthrough curves of CO2 (3.5%) and H2O (20% P/P0) on a sample of Zeolite 13X.
Image Credit: Surface Measurement Systems Ltd
After only 15 minutes, a relatively fast CO2 breakthrough is observed, as is a much slower water breakthrough of nearly four hours. As the water replaces adsorbed CO2, a characteristic “roll-up” effect is observed, leading to a higher outlet concentration than the inlet while the waterfront passes through the column. Over three cycles, near-perfect repeatability is achieved.
The curves can be integrated from 0 to 300 mins when both components have broken through to obtain the adsorbed amount of each component, yielding 0.55 wt% of CO2 and 23.4 wt% of water.
Two assumptions are kept in mind when the previous mass balance is made. Firstly, it is assumed that the pressure drop over the column is negligible, verified using integrated pressure sensors in the BTA Frontier. Secondly, it is assumed that the inlet flowrate is the same as the outlet flowrate, which is a valid assumption at the low adsorbate concentrations used.
Breakthrough experiments are crucial to assessing real-world performance of gas sorption materials.
Conclusion
Gas capture, separation and storage is a crucial driver of research in industry and academia and is also of significant importance to energy and the environment. It is important to be aware of the wide range of sorption characteristics techniques available and to apply the most relevant technique for a material and application.
Surface Measurement Systems offers a wide range of instruments. These instruments can operate in various modes, such as dynamic, static, atmospheric flow, and reduced pressure.
Each of these different operation modes offers unique benefits when designing experiments to model a wide variety of systems.
Surface Measurement Systems is a world leader in sorption science, and its techniques and expertise offer solutions at every stage of material screening for gas capture applications.
Acknowledgments
Produced from materials originally authored by Connor Hewson, Majid Naderi, Manaswini Acharya, Meishan Guo, Paola Saenz Cavazos, Sean McIntyre, Armando Garcia, Paul Iacomi and Daniel Burnett of Surface Measurement Systems Ltd.
References and Further Reading
- D. S. Sholl, R. P. Lively, Nature 2016, 532, 435–437.
- E. Martínez-Ahumada, A. López-Olvera, V. Jancik, J. E. Sánchez-Bautista, E. González-Zamora, V. Martis, D. R. Williams, I. A. Ibarra, Organometallics 2020, 39, 883–915.
- J. A. C. Silva, K. Schumann, A. E. Rodrigues, Microporous Mesoporous Mater. 2012, 158, 219–228.
- P. A. Sáenz Cavazos, M. L. Díaz-Ramírez, E. Hunter-Sellars, S. R. McIntyre, E. Lima, I. A. Ibarra, D. R. Williams, RSC Adv. 2021, 11, 13304–13310.
- H. W. B. Teo, A. Chakraborty, S. Kayal, Appl. Therm. Eng. 2017, 120, 453–46

This information has been sourced, reviewed and adapted from materials provided by Surface Measurement Systems Ltd.
For more information on this source, please visit Surface Measurement Systems Ltd.