Reviewed by Alex SmithSep 6 2023
Dynamic light scattering (DLS) microrheology utilizes dynamic light scattering to conduct measurements of the mean square displacements (MSD) of added inert tracer particles in a solution environment and to acquire the rheological information of solutions.
DLS microrheology can characterize weakly structured polymer and protein solutions and gel systems, where tracer particles can diffuse over large distances.
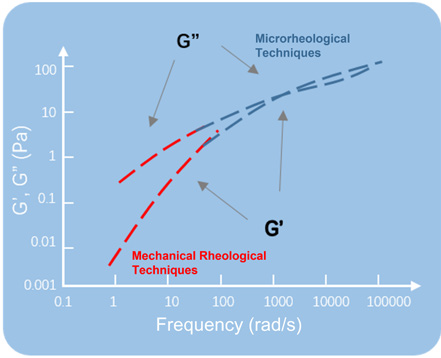
Figure 1. The detection frequency range of microrheological and mechanical rheological techniques. Image Credit: Bettersize Instruments Ltd
DLS microrheology enables simple and rapid measurements and data treatment compared to the mechanical rheological method. It also enables high-frequency information to be attained in just one measurement.
The tracer particles, such as a dilute polymer or protein solution, are added to the examined system. The particles are suspended in a solution system and randomly move via thermal energy exchange kBT.
The surrounding environment's rheological properties determine the tracer particles' motion. The detection of the motion of tracer particles offers rheological information.
This article presents an experiment that studies the measurement of sucrose samples with varying concentrations and characterization of the viscoelastic information of the solutions using the BeNano 180 Zeta nanoparticle size and zeta potential analyzer from Bettersize Instruments and the DLS microrheology method.
Theory
DLS microrheology involves colloidal particles (within the range of 0.3 - 2.0 μm in size and with known size information) being added as tracer particles. The motion of the tracer particles is representative of the rheological properties of the environment.
For a purely viscous fluid sample (a Newtonian fluid), the tracer particles diffuse freely through the whole sample environment, and the MSD ⟨Δr2(τ)⟩ of the particle linearly increases with time:
⟨Δr2(τ)⟩ = 6Dτ
Here, D denotes the diffusion coefficient of the particle.
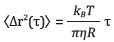
The standard Stokes-Einstein equation can be used as follows:

In this equation, R denotes the radius of the tracer particle. This equation can be used to form the relation between MSD and viscosity as follows:
The Newtonian fluid's viscosity, denoted by η, may be obtained by fitting the curve of ⟨Δr2(γ)⟩ with time. However, for non-Newtonian fluids that comprise elastic components, a generalized version of the Stokes-Einstein equation can be utilized:
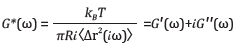
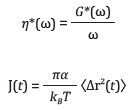
Here, the elastic (storage) modulus G' and the viscous (loss) modulus G'' are derived by ⟨Δr2(t)⟩ as a function of frequency. The complex viscosity η*(ω) and creep compliance J(t) may be obtained as follows:
Instrumentation
The BeNano 180 Zeta was employed, equipped with a laser beam with a wavelength of 671 nm and a power of 50 mW as a light source. The instrument was also equipped with avalanche photodiode detectors (APD) which were set up to obtain scattered light signals at an angle of 173°.
Sample Preparation and Measurement Condition
Sucrose solution samples were prepared according to Table 1.
Table 1. Information of sucrose sample solutions. Source: Bettersize Instruments Ltd
| Sample |
Concentration of Solution (w/v) |
Dispersant |
| Sucrose |
25% |
Distilled Water |
| Sucrose |
40% |
Distilled Water |
| Sucrose |
50% |
Distilled Water |
The BeNano’s integrated temperature control system was utilized to maintain the measurement temperature at 25 ± 0.1 ℃. An addition of 10 μL of negatively charged 400 nm polystyrene spheres into the 1 mL of the sucrose solution was made with the spheres serving as tracer particles.
Results
The correlation functions of the samples were determined by calculating the fluctuation of the scattered signals:
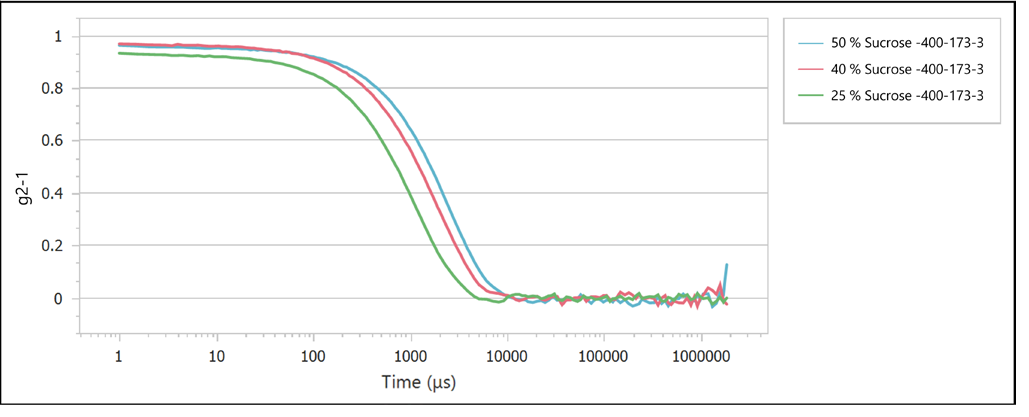
Figure 2. Correlation functions of sucrose solutions with varying concentrations. Image Credit: Bettersize Instruments Ltd
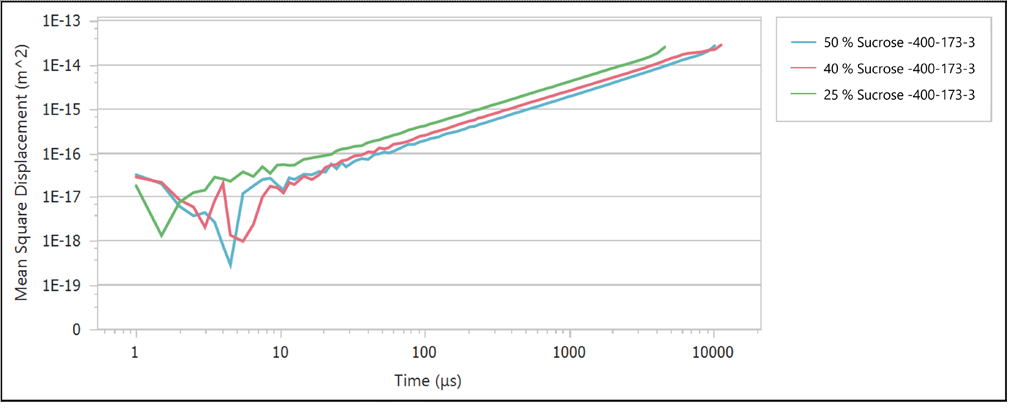
Figure 3. MSD curves of sucrose solutions with varying concentrations. Image Credit: Bettersize Instruments Ltd
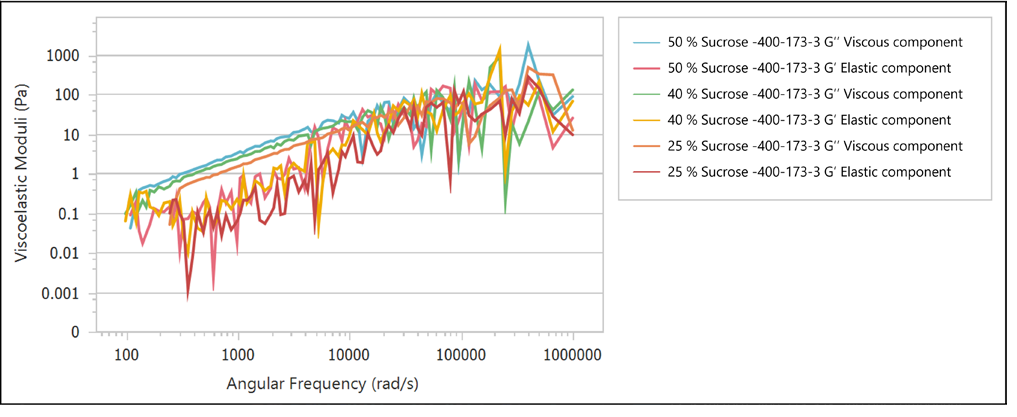
Figure 4. Viscoelastic modulus curves of sucrose solutions with varying concentrations. Image Credit: Bettersize Instruments Ltd
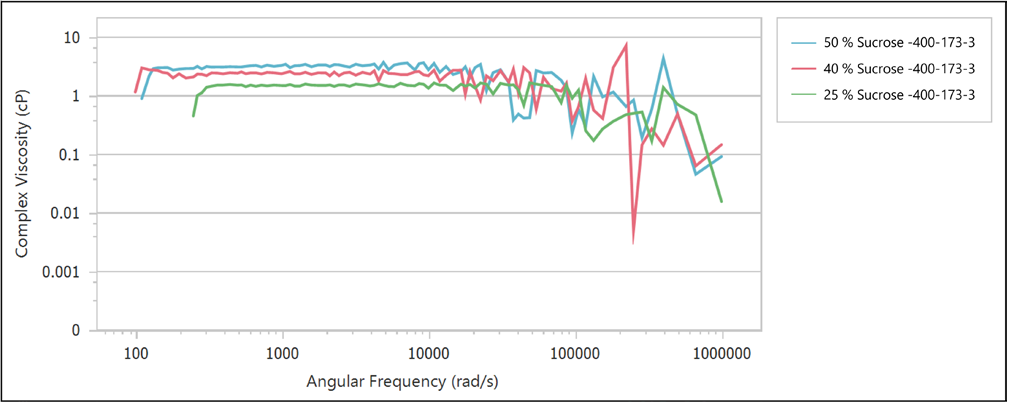
Figure 5. Complex viscosity curves of sucrose solutions with varying concentrations. Image Credit: Bettersize Instruments Ltd
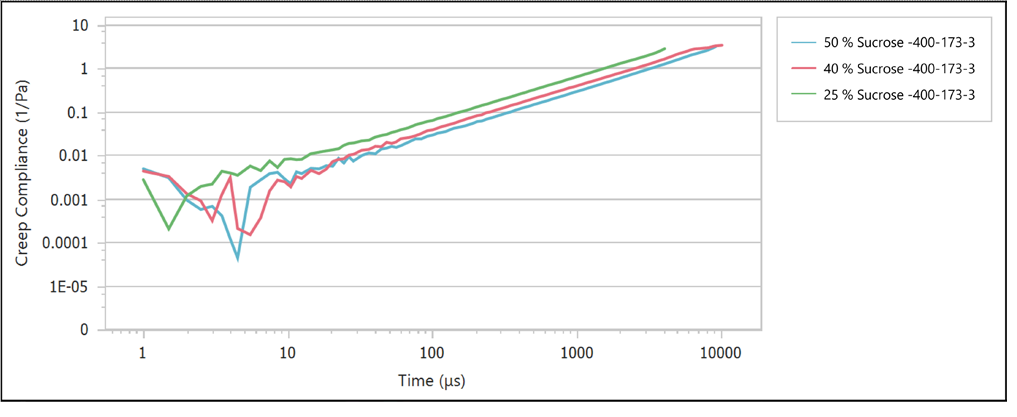
Figure 6. Creep compliance curves of sucrose solutions with varying concentrations. Image Credit: Bettersize Instruments Ltd
Table 2 details the measurement results.
Table 2. The complex viscosity results of sucrose solutions with varying concentrations. Source: Bettersize Instruments Ltd
| Sample Name |
Complex viscosity @ 1044 rad/sm Pa.s |
| 25% Sucrose |
1.53 |
| 40% Sucrose |
2.55 |
| 50% Sucrose |
3.56 |
As the concentration of the sucrose solutions increased, the decay time of the correlation functions also increased, as displayed in Figure 2.
This suggests that the tracer particles’ movement is slower at higher concentrations of sucrose solutions, in viscosity of the sucrose solutions with concentration (as shown in Table 2 and Figure 5).
Higher sucrose concentrations were linked with lower tracer particle velocities and lower MSD values, as displayed in Figure 3.
Figure 4 depicts the viscoelastic modulus curves where it can be observed that, between the concentrations of 25% and 50%, the solutions displayed a strong viscous modulus, and the viscoelastic moduli increased as the concentration increased.
Figure 5 presents the complex viscosity versus frequency curves. It is clear that in the relatively low-frequency range, the complex viscosity does not change much with variations in frequency.
However, in the relatively high-frequency range, the complex viscosity displays a certain downward trend, showing a weak shear thinning property.
Conclusion
These measurement results demonstrate the microrheology detection ability of the BeNano.
These results enable the rheological parameters of the sample, including the mean square displacement, viscoelastic moduli, complex viscosity, and creep compliance, to be rapidly acquired in the high-frequency range, offering a powerful tool for the characterization of the rheological properties of liquids.
Acknowledgments
Produced from materials originally authored by Alia Yan from the Application Research Lab at Bettersize Instruments Ltd.

This information has been sourced, reviewed and adapted from materials provided by Bettersize Instruments Ltd.
For more information on this source, please visit Bettersize Instruments Ltd.