Low-power batteries used to be a significant obstacle in our daily lives, with the nickel metal hydride batteries in early digital cameras barely lasting for 20 photos and the GAME BOY™ running out of power after only three hours of use.
Over the last two decades, however, high-energy rechargeable batteries have become a fundamental aspect of our mobile society. Without them, mobile work and leisure would be inconceivable.
From smartwatches, cell phones, and laptops to e-bikes and e-cars, rechargeable lithium-based batteries provide electrical energy everywhere. They boast an extended lifespan, are engineered for significantly more charging cycles, and store more energy compared to other batteries of similar weight and size.
Lithium-ion batteries can be categorized based on composition, such as lithium iron phosphate-based (LFP) or those combining lithium, nickel, cobalt, and manganese (NCM).
The rapidly growing volume of used batteries, particularly due to the rise of e-mobility, is amplifying the demand for efficient recycling processes. Looking ahead, it is projected that up to 65% of lithium-based batteries will be recycled in the European Union by mass.1
During the recycling process of spent batteries, their disassembly, crushing, and thermal treatment produces a granular or powdery dark mixture, the so-called "black mass.”
This mixture, depending on the battery type, contains various metals (e.g., lithium, cobalt, copper, nickel, manganese) and elemental carbon, such as graphite, a standard component in every battery as an anode material.
Depending on the reprocessing step in the recycling process, the black mass may also contain organic carbon compounds (OC), for instance, from plastic components, such as the separators, or from solvents, which are also contained in rechargeable batteries.
The multi-EA 4000 is ideal for monitoring different carbon parameters in black mass samples generated during the recycling process.
This analyzer is designed to separately determine various carbon species with a high level of automation following the VGB pyrolysis method2 and DIN EN 15936 solids TOC method.3
For the assessment of elemental carbon (EC), a pyrolysis step, where the sample undergoes high-temperature treatment in the absence of oxygen, is employed. In this process, organic carbon components experiencing thermal decomposition are released from the sample, leaving only elemental carbon (EC).
Subsequently, the EC undergoes conversion to CO2 during combustion in a pure oxygen atmosphere. Additionally, the total carbon (TC) is measured.
The amount of organic carbon (OC) is then calculated by determining the difference between TC and EC. These parameters serve to gauge the efficacy of large-scale thermal treatment and pyrolysis processes utilized in producing the black mass during the recycling of lithium-ion batteries.
Materials and Methods
The determination of organically bound carbon (OC) through the pyrolysis method followed a differential approach:
OC = TC - EC
For this purpose, two sample aliquots were weighed into ceramic boats for each determination. To measure EC, the furnace temperature of the multi EA 4000 was set to 850 °C, and the combustion tube was purged with a constant argon flow.
The ceramic boats containing the samples were then placed into the furnace using the FPG 48 solids sampler. After a pyrolysis time of 360 seconds, the system automatically switched from argon to oxygen.
The hot sample reacts immediately with the oxygen. During this process, the present EC is completely converted to CO2 and detected by NDIR spectrometry after appropriate purification and drying. Simultaneously, a second sample aliquot was directly transferred to the hot furnace to determine TC.
In this case, without a prior pyrolysis step, all contained carbon compounds were converted to CO2 in a pure oxygen stream.
The determination of EC and TC contents was performed entirely automatically by the control and evaluation software. Subsequently, the calculation of organic carbon (OC) was done externally based on the EC and TC measurement results.
Samples and Reagents
Pyrolyzed black mass (LFP) of different particle sizes:
- Sample 1: LFP black mass, filter fraction
- Sample 2: LFP black mass, fine (particle size 0‒0.25 mm), V1
- Sample 3: LFP black mass, coarse (particle size 0.25‒0.5 mm)
- Sample 4: LFP black mass, fine (particle size 0‒0.25 mm), V3
- Glassy carbon, powder, 99.95% C (Sigma-Aldrich) – calibration and system test
Sample Preparation
The samples that were analyzed were homogeneous, fine black powders of different grain sizes. As a result, a special sample preparation was not required.
Method Settings
For the analysis of both samples and standards, a method for combined EC/TC determination was employed. The settings for the process and detection parameters are outlined in Tables 1 and 2.
Table 1. Method parameters multi EA 4000. Source: Analytik Jena US
| Parameter |
Setting |
| FPG |
EC/TC_inorg_without_TIC_auto |
| Furnace temperature |
850 °C |
| EC – Purge time |
360 s |
| Oxygen |
2.5 L/min |
| Argon (pyrolysis) |
1.5 L/min |
| Suction flow (pump) |
1.7 L/min |
Table 2. Detection parameters – Carbon determination (NDIR). Source: Analytik Jena US
| Parameter |
Specification |
| Max. integration time |
1800 s |
| Start |
0.12 ppm |
| Threshold |
3 ppm |
| Stability |
3 |
Calibration
Before analysis, the multi EA 4000 underwent calibration using pure glassy carbon (99.95% C). The applied quantities and calibrated range are detailed in Table 3, and the corresponding calibration curves are depicted in Figures 1 and 2. The quality of calibrations was verified using another carbon standard.
Table 3. Calibration standard and ranges. Source: Analytik Jena US
| Parameter |
Standard |
C content (%) |
Quantity (mg) |
Calibrated range |
| EC |
Carbon |
99.95 |
13–110 |
13–110 mg C abs. |
| TC |
Carbon |
99.95 |
11–125 |
11–125 mg C abs. |
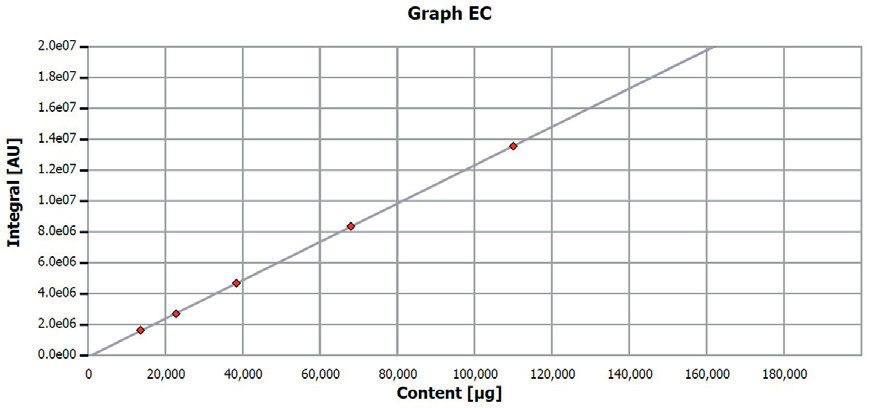
Figure 1. Calibration curve EC determination. Image Credit: Analytik Jena US
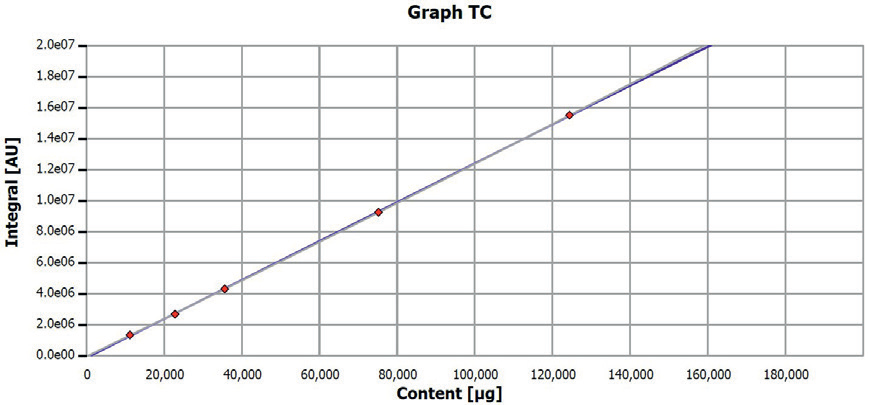
Figure 2. Calibration curve TC determination. Image Credit: Analytik Jena US
Results and Discussion
The samples were analyzed in triplicates, while standards underwent duplicate analysis. The resultant EC and TC curves are exemplified in Figures 3–10, with the measured results presented in Table 4 representing average values from the replicate analysis.
Exemplary measuring curves of the EC/TC measurements are featured in the subsequent figures, and the summarized results can be found in Table 3. Before measurements, all samples underwent testing for carbonate content, specifically total inorganic carbon (TIC). No significant contributions of TIC were identified.
Table 4. Results of EC, TC, and OC determination. Source: Analytik Jena US
| Sample ID |
EC ± SD (g/kg) |
TC ± SD (g/kg) |
OC* (g/kg) |
| Sample 1 (filter fraction) |
758.7 ± 5.06 |
772.8 ± 6.39 |
14.1 |
| Sample 2 (0–0.25 mm), V1 |
512.8 ± 3.61 |
522.4 ± 12.8 |
9.61 |
| Sample 3 (0.25–0.5 mm) |
241.9 ± 1.74 |
237.3 ± 0.39 |
0* |
| Sample 4 (0–0.25 mm), V3 |
223.3 ± 1.70 |
232.6 ± 4.48 |
9.32 |
| Standard, 99.95% C |
998.3 ± 0.54 |
985.2 ± 17.1 |
0* |
* calculated values, negative values set to 0
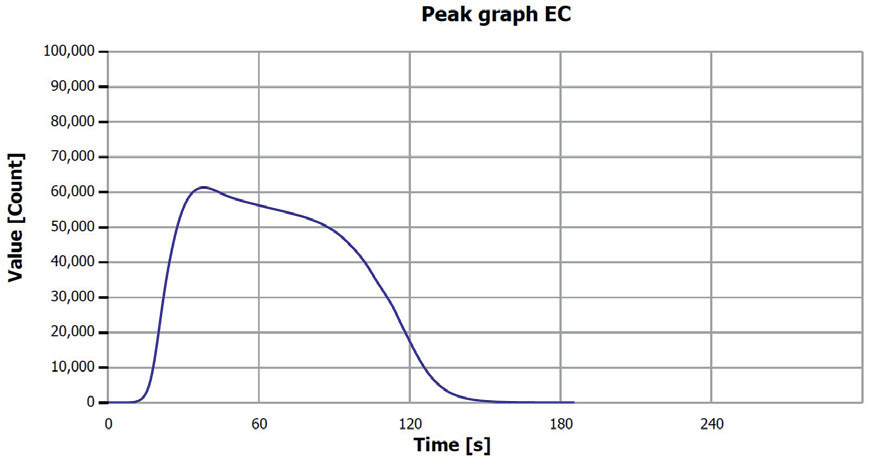
Figure 3. EC determination sample 1 (filter fraction). Image Credit: Analytik Jena US
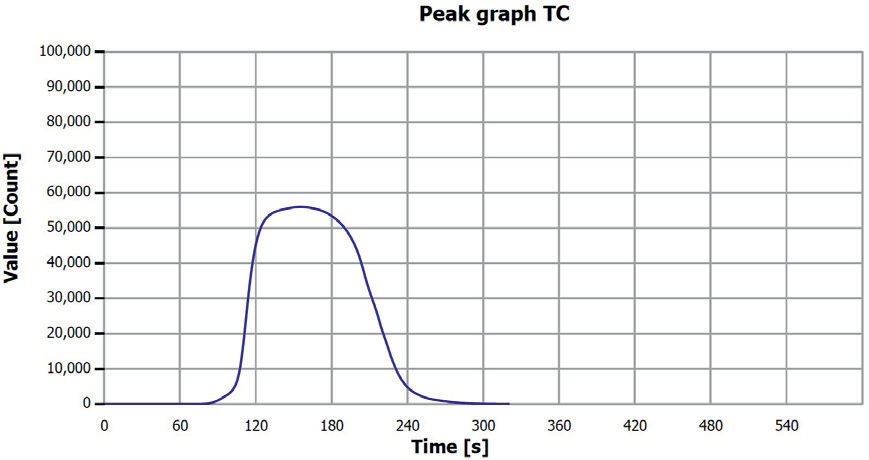
Figure 4. TC determination sample 1 (filter fraction). Image Credit: Analytik Jena US
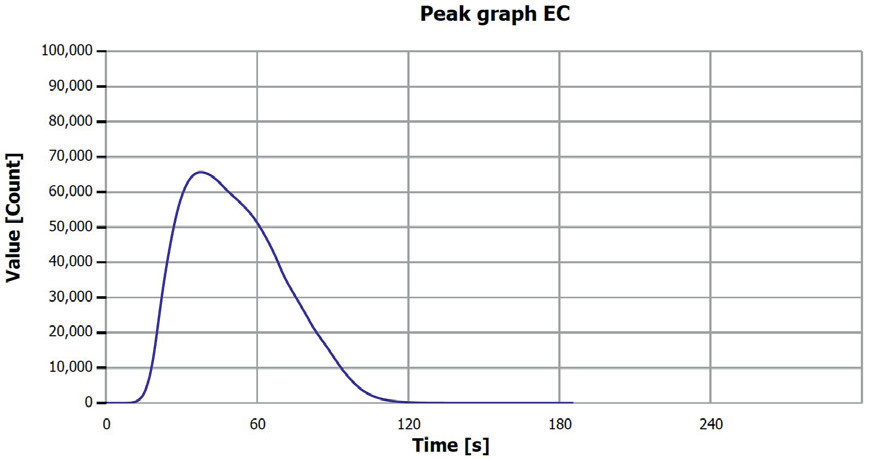
Figure 5. EC determination sample 2 (0–0.25 mm), V. Image Credit: Analytik Jena US
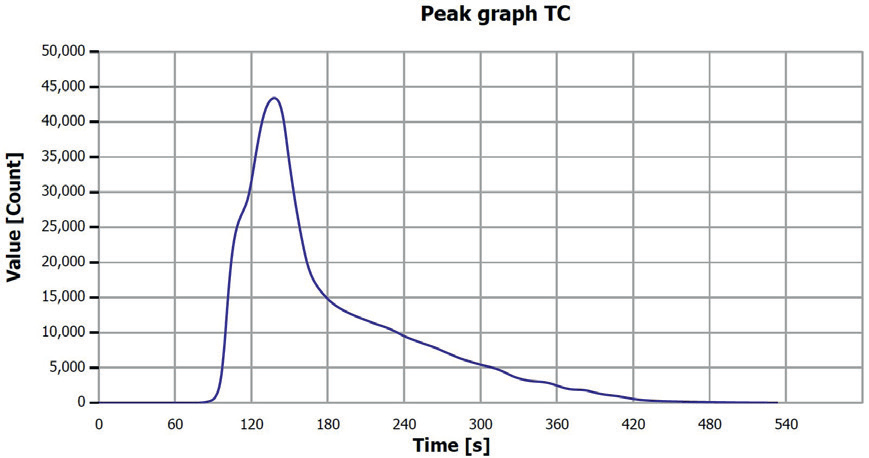
Figure 6. TC determination sample 2 (0–0.25 mm), V1. Image Credit: Analytik Jena US
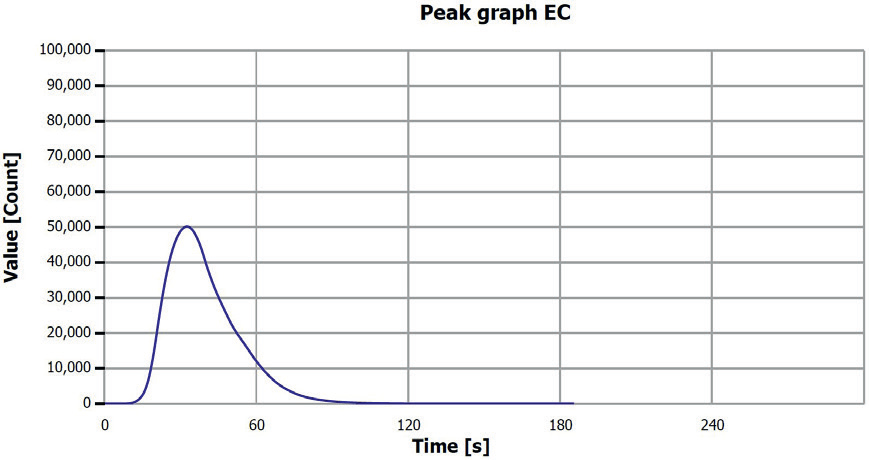
Figure 7. EC determination sample 3 (0.25–0.5 mm). Image Credit: Analytik Jena US
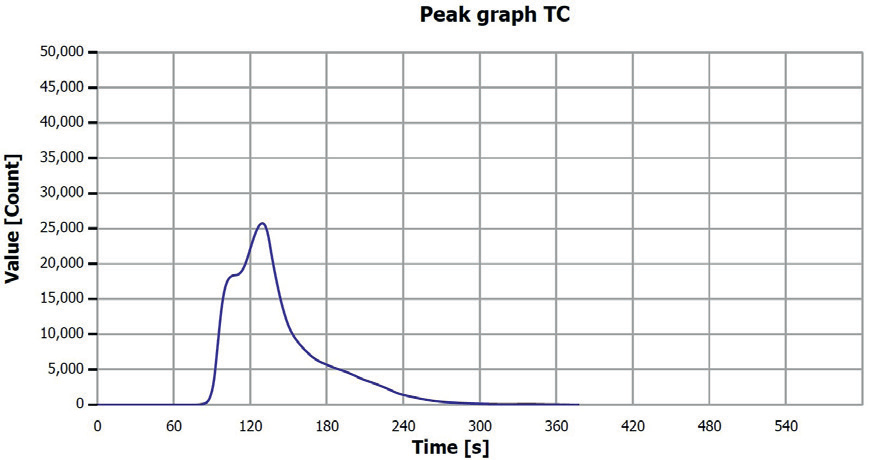
Figure 8. TC determination sample 3 (0.25–0.5 mm). Image Credit: Analytik Jena US
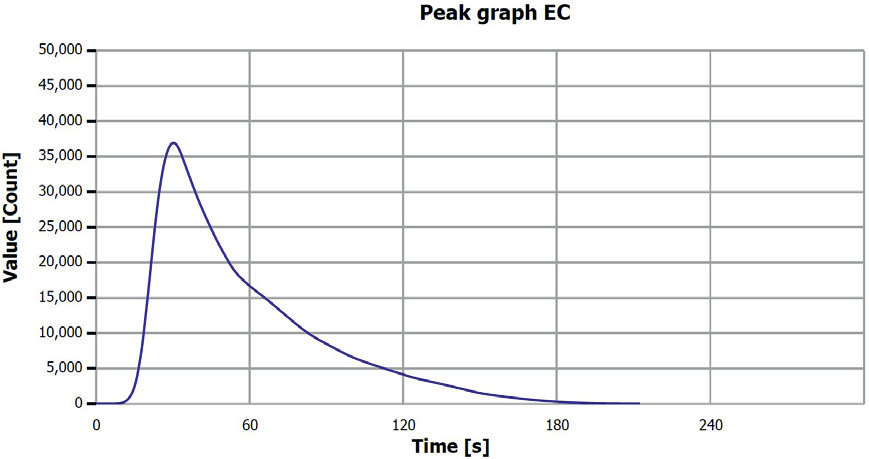
Figure 9. EC determination sample 4 (0-0.25 mm), V3. Image Credit: Analytik Jena US
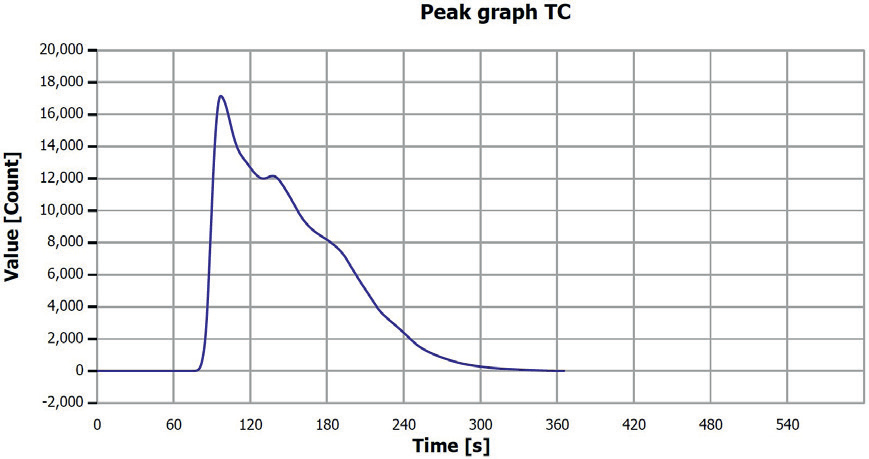
Figure 10. TC determination sample 4 (0-0.25 mm), V3. Image Credit: Analytik Jena US
Summary
The black mass samples from a lithium battery recycling process were analyzed quickly and easily with the elemental analyzer type multi EA 4000 (see Table 5 for configuration) for their elemental and organically bound carbon content.
The reproducibility of the EC/TC (Electrical Conductivity/Total Carbon) measurements for the samples was notably high. However, their occasionally very high contents mean that the variation (Standard Deviation, SD) in the measurement values could significantly impact the Organic Carbon (OC) contents determined through the difference method.
Enhancing the consistency of these results can be achieved by conducting more replicates and employing outlier selection methods, which in turn positively influences the accuracy of the calculated OC values.
The fully automated measurement procedure allowed for the separate determination of various carbon parameters with minimal effort for the operator.
Thanks to the broad measuring range of the NDIR detector, both very low (LOD: 10 µg abs.) and exceptionally high contents (≤ 500 mg C abs.) could be rapidly and quantitatively detected.
Additionally, the multi-EA 4000 can be expanded with optional accessories for other intriguing application tasks, such as automated TIC determination or the assessment of total sulfur (TS) and total halogens (TX).
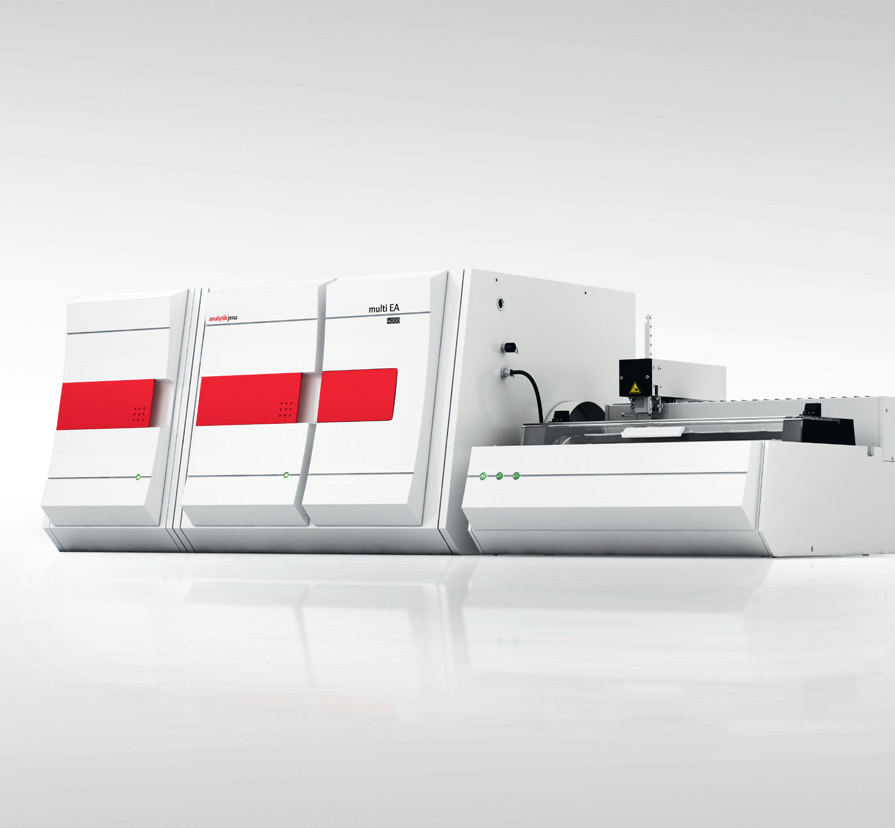
Figure 11. multi EA 4000 with pyrolysis function and FPG 48 solids sampler. Image Credit: Analytik Jena US
Recommended Device Configuration
Table 5. Overview of devices, accessories, and consumables. Source: Analytik Jena US
| Component |
Article number |
Description |
| multi EA 4000 with pyrolysis option |
450-126.568 |
Elemental analyzer for carbon determination with pyrolysis option |
| Solid autosampler FPG 48 |
450-126.574 |
Autosampler for 48 solid samples |
References
- European Commission; Proposal for a REGULATION OF THE EUROPEAN PARLIAMENT AND OF THE COUNCIL concerning batteries and waste batteries, repealing Directive 2006/66/EC and amending Regulation (EU) No 2019/1020, 2020, page 9.
- VGB PowerTech is an international interest group of companies from the electricity and heat supply industry, more information on www.vgbe.energy
- DIN EN 15936 Sludge, treated biowaste, soil, and waste - Determination of total organic carbon (TOC) by dry combustion

This information has been sourced, reviewed and adapted from materials provided by Analytik Jena US.
For more information on this source, please visit Analytik Jena US.