The variability in electrochemical activity within a battery electrode plays a critical role in defining its overall performance and lifespan. This can be determined by investigating bulk structural changes and local variations in morphology, as well as electrochemical performance.
Charge photometry accelerates the development and screening of novel battery materials by observing state-of-charge (SoC) changes under operando conditions at an individual particle level across the electrode. This article explores some example applications of charge photometry.
Charge photometry is a microscopy method based on light-scattering. It facilitates the visualization of the dynamic SoC in individual active particles throughout battery charge and discharge cycles.
The intensity of light scattered from the particles is dictated by their electronic polarizability. When ion insertion or extraction occurs at the particles, their electronic polarizability changes. As a consequence, the intensity of the scattered light is associated with the changing local SoC in the particles.
Using an optically-accessible coin cell, charge photometry gathers individual SoC information and morphological data for a population of particles across the electrode, along with synchronized electrochemistry data, on a benchtop device (Figure 1).
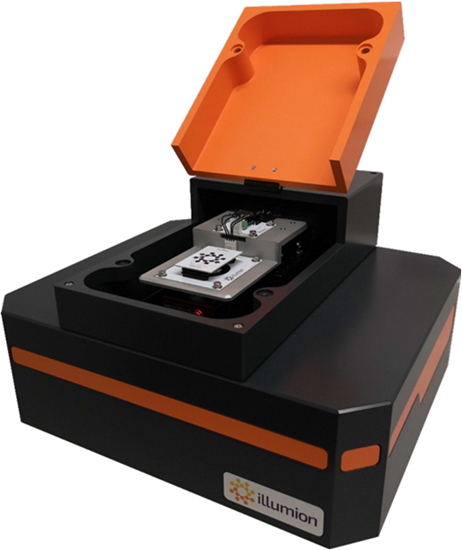
Figure 1. Bench-top charge photometry instrument. Image Credit: illumion
This creates the opportunity to characterize and screen the performance of electrode materials and cells, including:
- Evaluating heterogeneity in electrode activity under various (dis)charging conditions
- Assessing the extent of degradation during successive cycles
The ability to directly visualize changes in local ion concentrations within active particles also enables comprehensive mechanistic studies to be conducted down to the single particle level. For example:
- Mapping intra-particle ion gradients to infer ion transport rates and monitor capacity losses
- Monitoring phase transitions and probing ion transport mechanisms
Case Study 1: Visualizing the Variation in Electrode Electrochemical Activity Under Different Charging Rates
Evaluating the rate performance of electrodes is a crucial aspect of developing new, rapidly charging battery materials.
Charge photometry can be employed to study the variations in electrochemical performance under different charging rates by examining the resulting variation in SoC across the electrode.
The charge photometry contrast from individual active particles changes as they are cycled. This provides a direct visualization of their electrochemical activity, with the changes in scattering intensity serving as an indicator of the (de)lithiation of the active particle.
Increased heterogeneity in the SoC across the electrode typically result in diminished battery performance and cycling stability.
Ni-rich NMCs (LiNi0.8 Mn0.1Co0.1O2) are important next-generation cathode materials for lithium-ion batteries because of their high capacities. In this case study, coin cells with a Ni-rich NMC cathode underwent charging at rates of C/3 and 2C. The charge photometry contrast variation was recorded for a group of active particles.
Figure 2(a) illustrates two example active particles, Particle A and Particle B. Figures 2(b) and 2(c) portray the cell electrochemistry and the individual particle contrast traces for the two charging rates. The contrast correlates to the local SoC and lithium-ion concentration, increasing during delithiation and decreasing during lithiation.
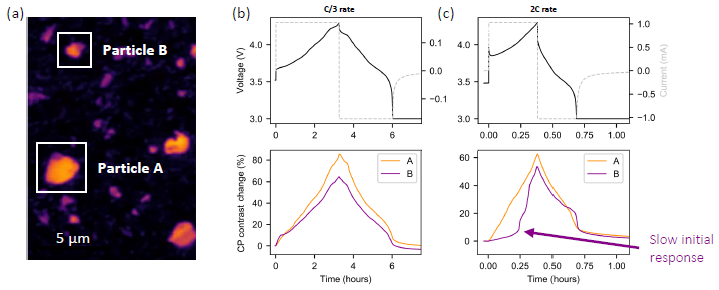
Figure 2. (a) two example active particles, Particle A and Particle B; (b) voltage-time plot and contrast trace for Particle A and Particle B under C/3 (3 hours) charging rate; (c) voltage-time plot and contrast trace for Particle A and Particle B under 2C (30 minutes) charging rate. Clear heterogeneity in (de)lithiation rate between the two particles is
observed at the faster charging rate. Image Credit: illumion
Particle B demonstrated a noticeable delay in the onset of delithiation compared to Particle A at the faster charging rate—shown in Figure 2(c). This was not observed at the slower charging rate. The quicker charging rate, therefore, resulted in augmented heterogeneity of electrochemical activity between the two particles.
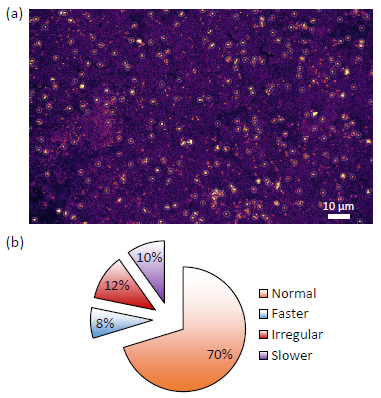
Figure 3. (a) charge photometry image taken with a wide field of view; (b) particle delithiation rate characterization. Image Credit: illumion
Figure 3(a) shows how this analysis can be expanded to encompass hundreds of active particles within one field of view. This enables the quantification of heterogeneities in the rates of (de)lithiation among many active particles across the electrode.
In this example, 10% of NMC particles analyzed exhibited a slower rate of delithiation than the population average, 8% had a faster rate, and 12% displayed irregular delithiation rates (including inactive particles) — shown in the pie chart in Figure 3(b).
Overall, this study underscores the potential of charge photometry for characterizing and spatially-resolving the electrochemical performance in electrodes under different conditions and (dis)charging rates.

 Download the Full Whitepaper
Case Study 2: Deducing Capacity Loss Mechanisms - Mechanical Degradation
The development of Li-rich and Li-poor domains within an active particle during cycling can lead to internal stresses and strains. Taken to an extreme under fast charging and discharging conditions, this can lead to the mechanical degradation of active particles and accelerated capacity loss.
In this case study , a high-rate anode material, Nb14W3O44 (NWO), was cycled at rates of up to 30C to evaluate degradtaion in the individual active particles.
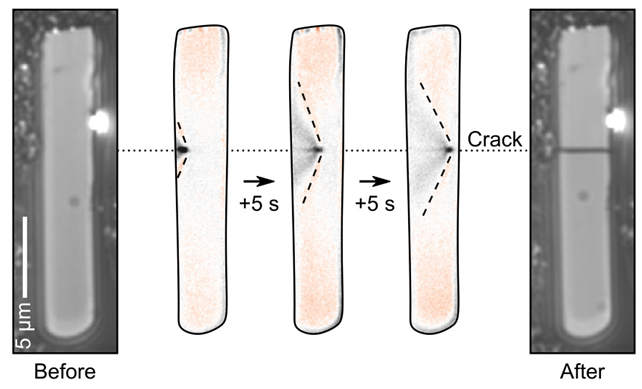
Figure 4. Sequence of images showing the real-time observation of a particle cracking using charge photometry. Image Credit: illumion
Figure 4 offers an image series featuring a rod-shaped NWO active particle, demonstrating cracking induced under high delithiation rates. The propagation of the crack across the particle was observed in real-time using charge photometry. The same charge photometry measurement also revealed the development of lithium-ion concentration gradients within the particle, leading to internal stresses and the subsequent particle fracture.
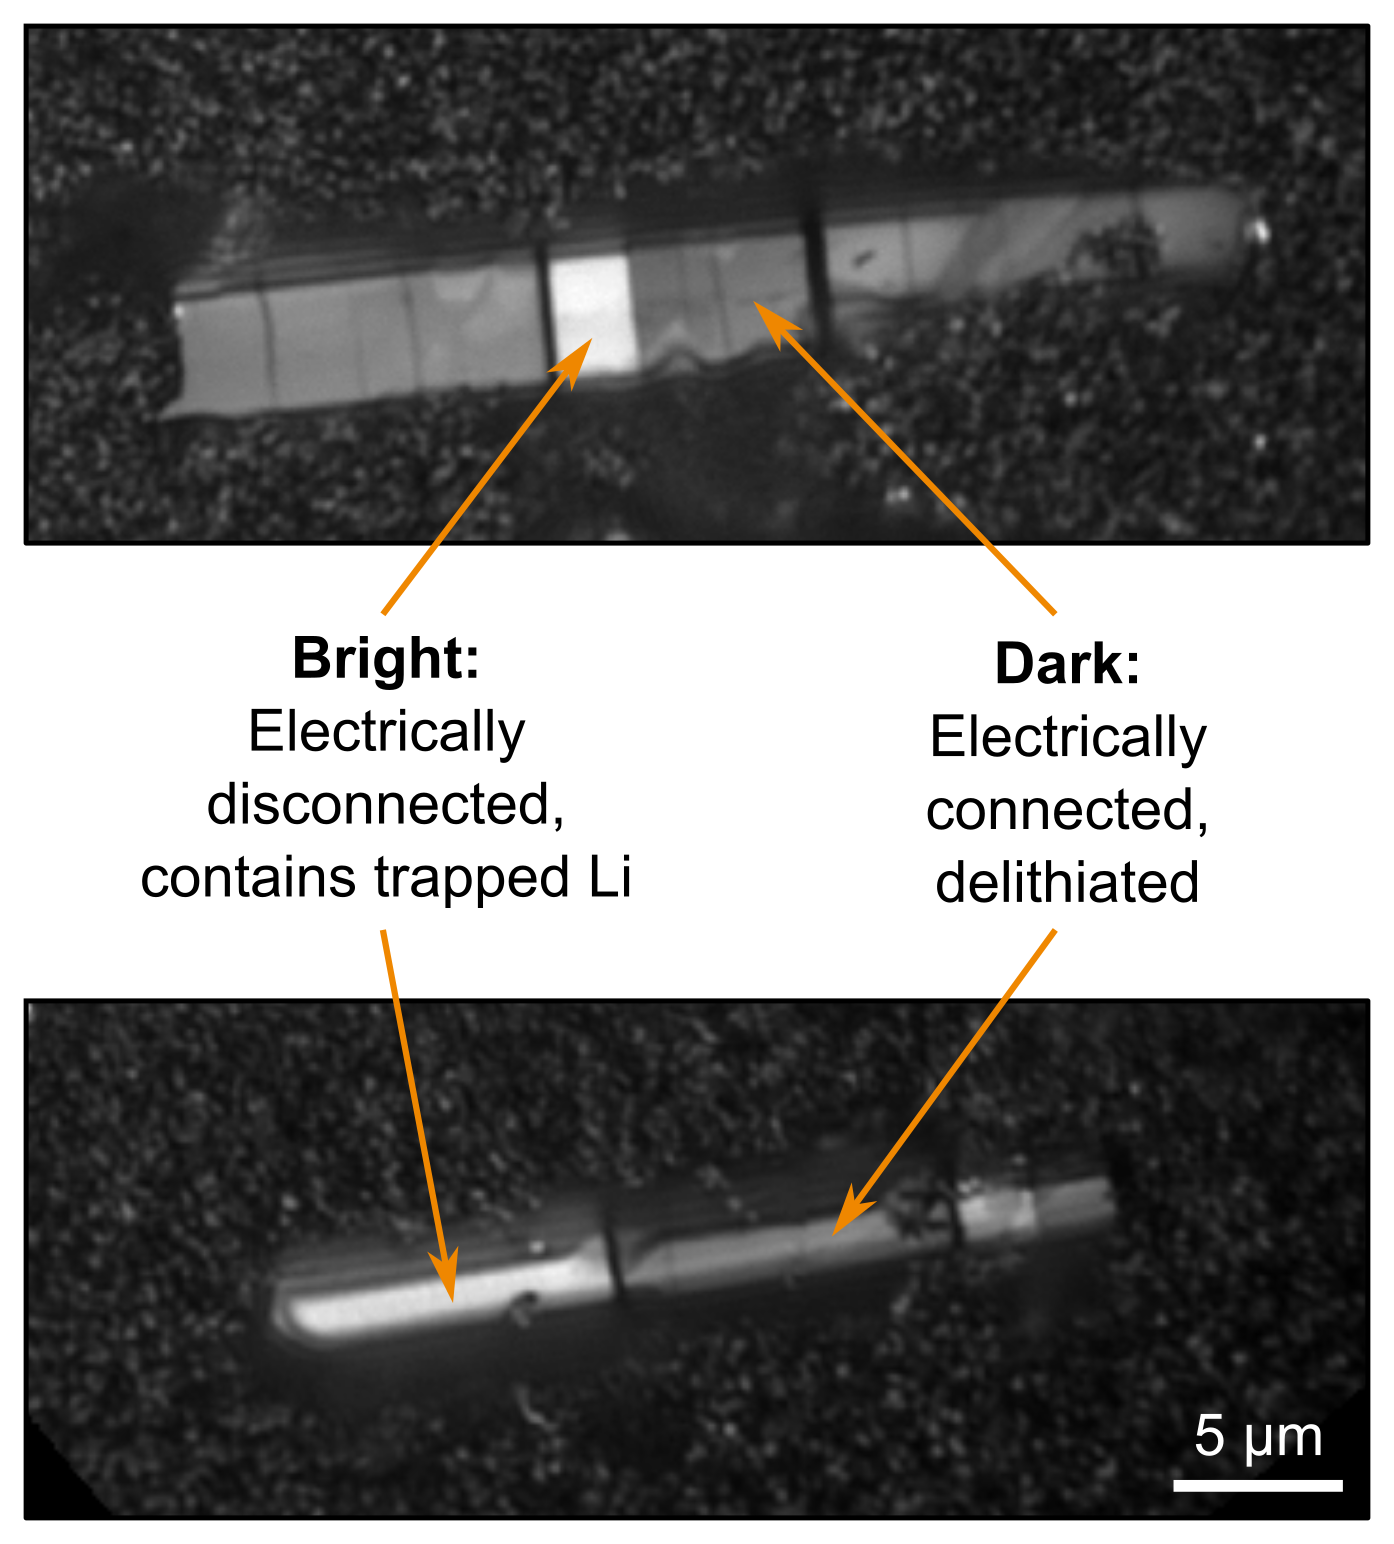
Figure 5. charge photometry images of the delithiated electrode. Image Credit: illumion
Particle fracture can change the electrical connectivity of the electrode and result in a loss of capacity. Figure 5 depicts charge photometry images of the delithiated electrode, where brighter fragments indicate the presence of trapped lithium within some fragments of cracked active particles. This indicates that these fragments are electrically disconnected from the rest of the electrode, reducing the capacity of battery.
This research demonstrates the utilization of charge photometry to enable real-time monitoring of mechanical deterioration in active particles, especially during rapid charging. Additionally, it allows for the subsequent identification of inactive electrically-isolated fragments, thereby facilitating inquiries into the rate performance and capacity degradation of electrode materials.

This information has been sourced, reviewed and adapted from materials provided by illumion.
For more information on this source, please visit illumion.