Sponsored by PerkinElmerReviewed by Louis CastelMay 14 2024
Per- and polyfluoroalkyl substances (PFAS) are a class of synthetic chemicals that have been employed in a wide range of industries worldwide since the 1940s.1,2
This includes equipment for packaging and processing meals, commercial household items, such as nonstick cookware and cleaning supplies, and industrial products like automotive lubricants and electronics, among many other applications.3-6
Image Credit: Christopher Slesarchik/Shutterstock.com
Perfluorooctanoic acid (PFOA) and perfluorooctanesulfonic acid (PFOS) are the most widely produced and researched of these compounds. Initially thought to be physiologically inactive, further research has demonstrated their toxicity to humans and wildlife.
In addition, many of these compounds are highly stable in the environment and the human body, which means they are difficult to break down and can accumulate over time.7,8
Growing health concerns about PFAS and their presence in consumer products and the environment highlight the crucial need to execute existing and new regulatory measures efficiently and reliably using commercially available instruments.
The United States Environmental Protection Agency (EPA) has developed methods 537.1 and 533 to analyze PFAS in drinking water.9,10
However, EPA Method 1633, which was still in draft when this article was published, is a more comprehensive approach for measuring 40 PFAS target analytes in various sample matrices.11
This approach is also used under the Clean Water Act (CWA) to determine PFAS in aqueous, solid (soil, biosolids, sediment), and tissue samples using isotope dilution, anion exchange solid phase extraction (SPE), and liquid chromatography/tandem mass spectrometry (LC/MS/MS).
Laboratories undertaking EPA 1633 analysis must overcome some of the routine challenges caused by the complex matrices of PFAS samples. Contamination and matrix-induced contamination are two critical factors to consider when assessing PFAS.
This article describes the verification of EPA Method 1633 and the creation of a better version of this methodology using the PerkinElmer LX50 UHPLC System and the PerkinElmer QSight® 420 Triple Quadrupole Mass Spectrometer, which allows for reduced analysis time.
This article also provides best practices for the mitigation of matrix-induced contamination.
Experimental
Materials and Reagents
Table 1 shows the mixed PFAS standards received from Wellington Laboratories, which include target PFAS analyte standards, Extracted Internal Standards (EIS), and Non-extracted Internal Standards (NIS).
VWR supplied both LC/MS-grade methanol (MeOH) and LC/MS-grade water (reagent water). Sigma Aldrich acquired the ammonium acetate solution, LC/MS-grade acetonitrile, acetic acid, and formic acid. Fisher Scientific acquired the ammonium hydroxide.
The PerkinElmer SPE manifold system, which was used to extract all water samples, was modified to enable the extraction of large-volume samples by adding Freelin-Wade linear low-density polyethylene tubing (LLDPE) and Sigma Aldrich SPE tube adaptors.
Strata X-AW 33 µm weak anion exchange SPE cartridges (0.5 g, 6 mL) were used to extract analytes. Sigma Aldrich supplied the 250 mL high-density polyethylene (HDPE) bottles utilized to manufacture and extract all blanks, spiked blanks, field samples, and QC samples.
The HPLC autosampler employed 300 µL PerkinElmer low-volume polyethylene (PE) vials with Sigma Aldrich polyethylene vial caps. Polyethylene vials and caps are necessary to prevent PFAS compounds from adsorbing on glass vials and to remove PFAS materials often found in HPLC vial septa.
Table 1. Target analytes, extracted, and non-extracted internal standards. Source: PerkinElmer
| Standard Type |
| Target PFAS 40 Analytes Total |
| 4 target PFAS – Native Replacement PFAS Solution / Mixture |
4 target PFAS – Native Perfluoroalkyl Ether Carboxylic Acids and
Sulfonate Solution / Mixture |
| 25 target PFAS – Native Replacement PFAS Solution / Mixture |
4 target PFAS – Native Perfluorooctanesulfonamide and
Perfluoroctanesulfonamidoethanol Solution / Mixture |
| 3 target PFAS – Native X:3 Fluorotelomer Carboxylic Acid Solution / Mixture |
| Internal Standards 31 Analytes Total |
24 Extracted Internal Standards – Mass-Labeled PFAS Extraction
Standard Solution / Mixture |
7 Non-extracted Internal Standards – Mass-Labeled PFAS Injection
Standard Solution / Mixture |
Hardware/Software
The analytes were separated chromatographically using a PerkinElmer LX50 UHPLC System, and the results were detected using a PerkinElmer QSight 420 Triple Quadrupole Mass Spectrometer via electrospray ionization (ESI).
The LX50 Autosampler was updated with a PTFE Free Kit, which replaces all polytetrafluoroethylene (PTFE) tubing with polyether ether ketone (PEEK) tubing to minimize or remove any contamination from PFAS compounds introduced by the PTFE tube.
The kit also includes a PEEK needle fitted to the autosampler and a delay column (PerkinElmer Brownlee™ SPP C18 Column, 50 x 3.0 mm, 2.7 µm) installed in-line between the LX50 pump and the autosampler to trap and delay potential analytes from the LC pump and solvent reservoirs.
All instrument control, data acquisition, and data processing were executed using PerkinElmer Simplicity™ 3Q Software.
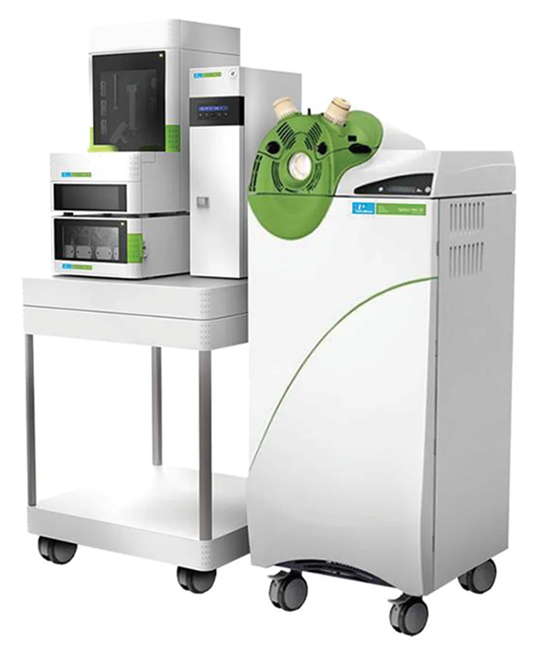
PerkinElmer QSight LC/MS/MS System. Image Credit: PerkinElmer
Method
LC Conditions and MS Parameters
Table 2 shows the LC technique and MS source parameters. This approach used a pair of C18 columns. A delay column and an analytical column (Brownlee SPP C18 Column, 75 x 4.6 mm, 2.7 µm) were employed to separate PFAS and other interfering components.
A Brownlee SPP C18 Column (5 mm x 4.6 mm, 2.7 µm) was also used as a guard column. The MS source characteristics, such as gas flows, temperatures, and probe position, were tuned for enhanced sensitivity.
Compound-specific characteristics like collision energy (CE), collision cell lens voltage (CCL2), and entrance voltage (EV) were optimized for the target compounds and internal standards.
Table 2. LC Method and MS Source Conditions. Source: PerkinElmer
| LC Conditions |
| Analytical Column |
Brownlee™ SPP C18 Column, 75 x 4.6 mm, 2.7 μm (PN: N9308415) |
| Guard Column |
Brownlee™ SPP C18 Column, 5 mm x 4.6 mm, 2.7 μm (PN: N9308532) |
| Delay Column |
Brownlee™ SPP C18 Column, 50 x 3.0 mm, 2.7 μm (PN: N9308408) |
| Mobile Phase A |
10 mM ammonium acetate in water |
| Mobile Phase B |
Methanol |
| Flow Rate |
0.8 mL/min |
| Run Time |
10.0 minutes |
| Column Oven Temperature (°C) |
40 |
| Auto Sampler Temperature (°C) |
15 |
| Injection Volume |
10.0 μL |
| Needle Wash 1 |
25% acetonitrile in methanol |
| Needle Wash 2 |
50% water in methanol |
| MS Source Conditions |
| Electrospray Voltage |
-2000 |
| Drying Gas |
110 |
| Nebulizer Gas |
380 |
| Source Temperature (°C) |
300 |
| HSID Temperature (°C) |
280 |
| Detection Mode |
Time Managed MRM |
Calibration Standards Preparation
According to EPA Method 1633 section 7.3, PFAS target analyte mixtures obtained from Wellington Laboratories were employed as the primary dilution standard (PDS).
The four PDS mixtures were combined into a single mixture (diluted-PDS) and further diluted in methanol with 4% water, 1% ammonium hydroxide, and 0.6% acetic acid to create seven calibration standards, according to Section 7.3.4 of the EPA Method 1633.
Further serial dilutions of the calibration standards were performed to ascertain the experimental limits of detection. Each calibration standard solution had a constant volume of Extracted Internal Standards (EIS) and Non-Extracted Internal Standards (NIS).
The analyte values in the calibration standards ranged from ~0.005 to 60 ng/mL. Calibration standards were moved to low-volume 300 µL polyethylene vials and caps for evaluation.
A wide range of calibration standards were employed to assess method linearity and instrument limits of quantitation (LOQ). A narrower range and fewer calibrants with a greater minimum level can be used in ordinary practice. The EPA approach requires at least six calibration levels.
Laboratory Method Blank, Field Samples, and Fortified Matrix Spiked Samples
All laboratory method blanks, field samples, and fortified laboratory matrix spikes were made in 250 mL polyethylene bottles with 250 mL of reagent water or aqueous sample. If the pH of the sample was less than 6.5 ± 0.5, it was adjusted using an ammonium hydroxide solution.
A constant volume of EIS was added to all method blanks, field samples, and fortified matrix spikes to monitor extraction efficiency based on recoveries, as well as the calculation of results.
The diluted PDS was also utilized as an analyte fortification solution, spiking varied volumes into the sample matrix to assess analyte recoveries at two distinct spiking levels. All method blank and fortified matrix spikes were extracted and concentrated using the SPE sample preparation procedure described in the next section.
The final 5.0 mL extracts were spiked with a consistent quantity of NIS before being transferred to vials with caps for LC/MS analysis. Method blanks were evaluated using the LC/MS equipment to ensure appropriate reduction or the absence of PFAS interferences.
Method blank extracts were regarded as acceptable if the analytes were absent or the concentrations met the acceptance requirements outlined in section 9.5 of EPA Method 1633.
Solid Phase Extraction and Sample Concentration
All extractions were carried out using a manual SPE vacuum manifold device. To prevent PFAS contamination, the SPE system was outfitted with LLDPE transfer lines, SPE tube adaptors, and PTFE-free manifold valves.
Extractions were carried out strictly following the procedure outlined in section 12.0 of EPA Method 1633. Weak anion exchange SPE 6 mL tubes containing 0.5 g of sorbent were used. The SPE cartridges were conditioned using 15 mL of 1% ammonium hydroxide in methanol and 5 mL of aqueous 0.3M formic acid in water.
Samples were added to the cartridges at a rate of 5 mL/min, followed by 5 mL of reagent grade water and 5 mL 1:1 Methanol: 0.1M formic acid in water used to clean the bottles. Air was pumped through the cartridges at a high vacuum (15-20 in. Hg) for two minutes to dry them.
PFAS analytes were removed from the cartridges by washing the bottles with a 5 mL aliquot of methanol containing 1% ammonium hydroxide (v/v) and then pulling them through an extraction apparatus.
The methanol extracts were collected in 15 mL polyethylene tubes. The extracts were spiked with an aliquot of NIS and moved to a polyethylene vial for final LC/MS analysis.
Results and Discussion
Mitigation of PFAS Background Contamination
One significant issue associated with PFAS trace analysis is contamination of blanks, samples, and QC samples caused by chemicals, sample collection materials, SPE apparatus, volumetric ware, vials, the LC/MS/MS system, and the lab environment.
Many of these interferences can be attributed to materials used in the production of volumetric ware, syringes, pipettes, tubing, and vials, as well as PTFE components present in the analytical system.
To prevent or mitigate these interferences in the analytical system, a delay column was installed between the pump’s mobile phase mixer and the autosampler’s sample valve to catch and delay any PFAS chemicals generated by the pump and mobile phase solvents.
This effectively separates the PFAS chromatographic peaks in the sample from any incoming PFAS contaminant peaks from the pump system. The LX50 Autosampler also has internal PTFE tubing connecting to the wash solution reservoirs, contributing to PFAS contamination.
This was resolved by replacing all of the PTFE tubing in the autosampler with PEEK tubing. Before running samples, all materials used in the current study were checked for PFAS contamination using blank samples. These experiments proved that all supplies utilized were free of PFAS contamination.
LC and MS/MS Methods
The MRM parameters of the QSight Triple Quadrupole Mass Spectrometer were optimized for each target analyte, EIS, and NIS using direct infusion experiments with a syringe pump.
After determining the precursor and product masses, Simplicity 3Q Software's autotune tool was used to optimize each compound's entrance voltage (EV), collision cell energy (CE), and collision cell lens 2 voltage (CCL2).
Once the retention periods for each analyte were determined, a time-managed MRM MS/MS method was utilized, with optimized time windows and dwell times to ensure at least ten scans across each analyte peak.
The LC gradient method was modified to give good analyte separation, reduce run time (ten minutes), and improve peak symmetry. A high-efficiency superficially porous particle (SPP) column was selected to offer narrow peaks and short run periods.
Figure 1 shows the total ion chromatogram (TIC). In the first demonstration of the LC method’s capability, baseline separation of branched vs. linear isomers was obtained for PFHxS, PFOS, PFOA, PFOSA, NMeFOSAA, NEtFOSAA, NMeFOSA, NEtFOSA, NMeFOSE, and NEtFOSE, as shown in Figure 5.
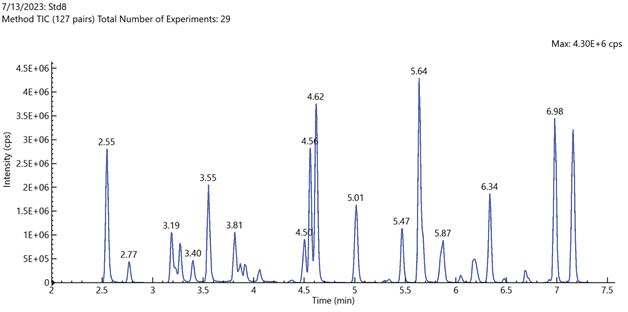
Figure 1. Total ion chromatogram of mid-level calibration curve standard sample containing all 71 method target analytes and internal standards. Image Credit: PerkinElmer
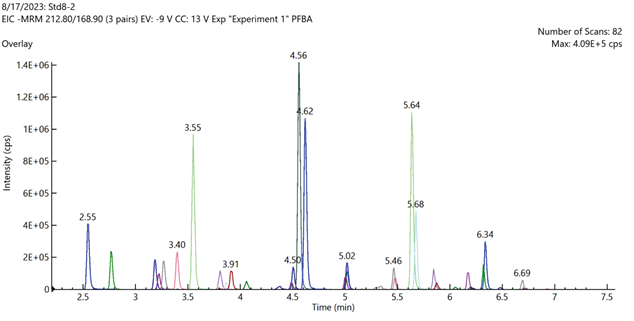
Figure 2. Total ion chromatogram of mid-level calibration curve standard sample containing all 40 method target analytes. Image Credit: PerkinElmer
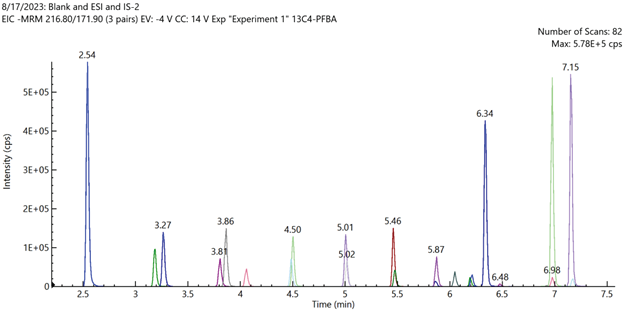
Figure 3. Total ion chromatogram of mid-level calibration curve standard sample containing all 24 extracted internal standards analytes. Image Credit: PerkinElmer
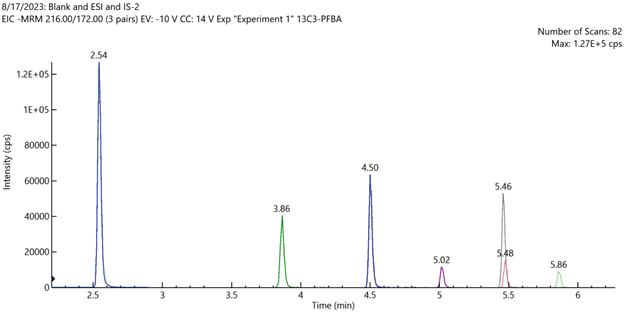
Figure 4. Total ion chromatogram of mid-level calibration curve standard sample containing all 7 non-extracted internal standards analytes. Image Credit: PerkinElmer
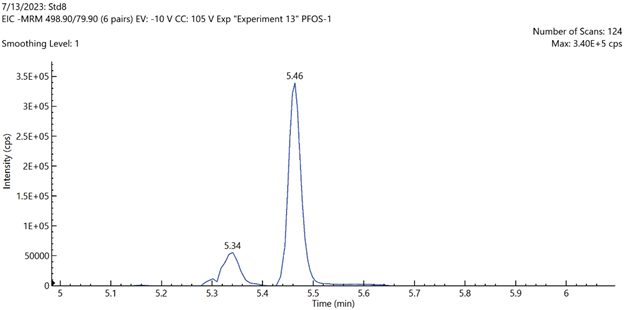
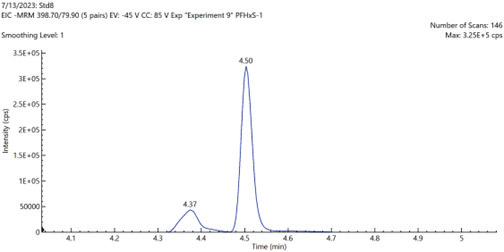
Figure 5. EIC chromatograms of PFOS and PFHxS shIC chromatogramsowing the baseline separation of linear and branched chain isomers. Image Credit: PerkinElmer
Linearity, Instrument Limits of Quantitation (LOQ), and Method Detection Limits (MDL)
Calibration curves were utilized to determine linearity, limits of quantitation (LOQ), and estimate method detection limits (MDL) for all PFAS target analytes. Non-weighted linear regression was used to create 10-point calibration curves for concentrations ranging from ~0.005 – 60 ng/mL.
Excellent linearity was attained over the concentration range examined, with all analytes having correlation coefficient values (R2) greater than 0.99. Linearity ranges exceed those shown by EPA 1633 and are listed in Table 4.
The Response Ratios (RR) and Response Factors (RF) were estimated using EPA method 1633, section 10.3.3. Table 3 shows that the Relative Standard Error (RSE) of RR and RF was computed for each target analyte and meets the quality requirement (≤ 20%).
The instrument limits of quantitation (LOQ) for each target analyte were determined by validating that the lowest level standard on the calibration curve (ng/mL) has a signal-to-noise ratio (S/N) ≥ 10.
Table 4 summarizes the instrument and method LOQs. MDL was computed using the LOQ values. Spiking tests must be conducted to confirm MDLs in a testing facility undertaking technique validation.
Table 3. Instrument and Method Calibration Ranges and Linearity (RSE) for 10-point calibration curves of all EPA Method 1633 target analytes. Source: PerkinElmer
| Compound |
LOQ (S/N: ≥ 10) (ng/mL) |
Dynamic Range (ng/mL)a |
RSE (n=10) (QC ≤20%)b |
EPA 1633 Table 4. Range (ng/mL) |
| PFBA |
0.022 |
0.022 - 228 |
4 |
0.8 - 250 |
| PFPeA |
0.083 |
0.083 - 114 |
9 |
0.4 - 125 |
| PFHxA |
0.042 |
0.042 - 57 |
13 |
0.2 - 62.5 |
| PFHpA |
0.042 |
0.042 - 57 |
11 |
0.2 - 62.5 |
| PFOA |
0.042 |
0.042 - 57 |
16 |
0.2 - 62.5 |
| PFNA |
0.042 |
0.042 - 57 |
11 |
0.2 - 62.5 |
| PFDA |
0.078 |
0.078 - 57 |
7 |
0.2 - 62.5 |
| PFUnA |
0.078 |
0.078 - 57 |
19 |
0.2 - 62.5 |
| PFDoA |
0.078 |
0.078 - 57 |
15 |
0.2 - 62.5 |
| PFTrDA |
0.157 |
0.157 - 57 |
10 |
0.2 - 62.5 |
| PFTeDA |
0.157 |
0.157 - 57 |
17 |
0.2 - 62.5 |
| PFBS |
0.042 |
0.042 - 57 |
8 |
0.2 - 62.5 |
| PFPeS |
0.042 |
0.042 - 57 |
8 |
0.2 - 62.5 |
| PFHxS |
0.042 |
0.042 - 57 |
6 |
0.2 - 62.5 |
| PFHpS |
0.042 |
0.042 - 57 |
5 |
0.2 - 62.5 |
| PFOS |
0.042 |
0.042 - 57 |
14 |
0.2 - 62.5 |
| PFNS |
0.042 |
0.042 - 57 |
9 |
0.2 - 62.5 |
| PFDS |
0.042 |
0.042 - 57 |
11 |
0.2 - 62.5 |
| PFDoS |
0.042 |
0.042 - 57 |
9 |
0.2 - 62.5 |
| 4:2FTS |
0.166 |
0.166 - 52 |
19 |
0.8 - 50 |
| 6:2FTS |
0.022 |
0.022 - 52 |
9 |
0.8 - 50 |
| 8:2FTS |
0.166 |
0.166 - 52 |
15 |
0.8 - 50 |
| PFOSA |
0.005 |
0.005 - 57 |
15 |
0.2 - 62.5 |
| NMeFOSAA |
0.042 |
0.042 - 57 |
12 |
0.2 - 62.5 |
| NEtFOSAA |
0.078 |
0.078 - 57 |
12 |
0.2 - 62.5 |
| NMeFOSA |
0.042 |
0.042 - 57 |
10 |
0.2 - 62.5 |
| NEtFOSA |
0.042 |
0.042 - 57 |
11 |
0.2 - 62.5 |
| NMeFOSE |
0.055 |
0.055 - 571 |
9 |
2 - 625 |
| NEtFOSE |
0.055 |
0.055 - 571 |
10 |
2 - 625 |
| PFMPA |
0.011 |
0.011 - 114 |
7 |
0.4 - 125 |
| PFMBA |
0.011 |
0.011 - 114 |
6 |
0.4 - 125 |
| PFEESA |
0.011 |
0.011 - 114 |
9 |
0.4 - 125 |
| NFDHA |
0.354 |
0.354 - 114 |
11 |
0.4 - 125 |
| 9Cl-PF3ONS |
0.022 |
0.022 - 238 |
13 |
0.8 - 250 |
| 11Cl-PF3OUdS |
0.022 |
0.022 - 238 |
9 |
0.8 - 250 |
| HFPO-DA |
0.173 |
0.173 - 238 |
10 |
0.8 - 250 |
| ADONA |
0.022 |
0.022 - 238 |
13 |
0.8 - 250 |
| 3:3FTCA |
0.222 |
0.222 - 304 |
12 |
1 - 312 |
| 5:3FTCA |
0.146 |
0.146 - 1523 |
19 |
5 -1560 |
| 7:3FTCA |
0.146 |
0.146 - 1523 |
20 |
5 -1560 |
a. Instrument calibration range is the actual concentration range of calibration standards used to determine calibration curves.
b. RSE values are calculated from 10 points of the calibration curves.
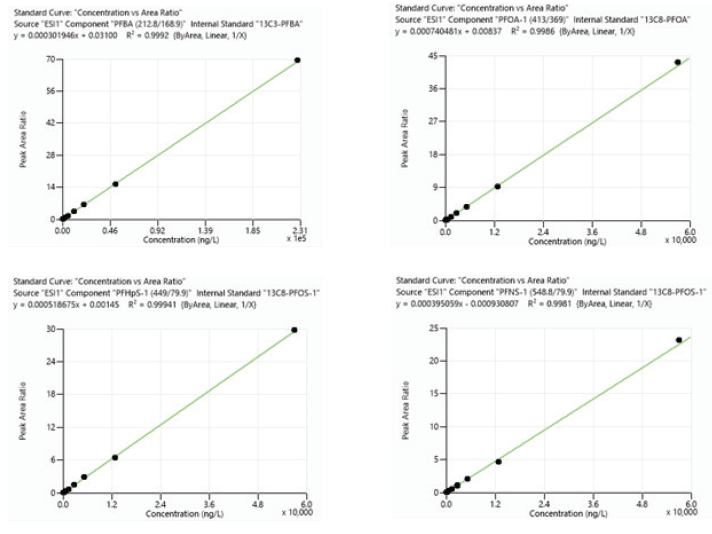
Figure 6. Calibration curves for representative analytes PFBA, PFOA, PFHpS, and PFNS. Image Credit: PerkinElmer
Table 4. Instrument limits of quantitation (LOQ) and method detection limits (MDL) for all target analytes in EPA Method 1633. Source: PerkinElmer
| Compound |
Instrument LOQ (ng/mL)a |
Method MDL (ng/L)b |
MDL EPA 1633 Table 8 (ng/L) |
| PFBA |
0.022 |
0.44 |
0.79 |
| PFPeA |
0.083 |
1.66 |
0.54 |
| PFHxA |
0.042 |
0.84 |
0.46 |
| PFHpA |
0.042 |
0.84 |
0.37 |
| PFOA |
0.042 |
0.84 |
0.54 |
| PFNA |
0.042 |
0.84 |
0.45 |
| PFDA |
0.078 |
1.56 |
0.52 |
| PFUnA |
0.078 |
1.56 |
0.45 |
| PFDoA |
0.078 |
1.56 |
0.40 |
| PFTrDA |
0.157 |
3.14 |
0.46 |
| PFTeDA |
0.157 |
3.14 |
0.49 |
| PFBS |
0.042 |
0.84 |
0.37 |
| PFPeS |
0.042 |
0.84 |
0.50 |
| PFHxS |
0.042 |
0.84 |
0.54 |
| PFHpS |
0.042 |
0.84 |
0.50 |
| PFOS |
0.042 |
0.84 |
0.63 |
| PFNS |
0.042 |
0.84 |
0.47 |
| PFDS |
0.042 |
0.84 |
0.60 |
| PFDoS |
0.042 |
0.84 |
0.60 |
| 4:2FTS |
0.166 |
3.32 |
1.69 |
| 6:2FTS |
0.022 |
0.44 |
2.45 |
| 8:2FTS |
0.166 |
3.32 |
2.50 |
| PFOSA |
0.005 |
0.10 |
0.32 |
| NMeFOSAA |
0.042 |
0.84 |
0.68 |
| NEtFOSAA |
0.078 |
1.56 |
0.59 |
| NMeFOSA |
0.042 |
0.84 |
0.43 |
| NEtFOSA |
0.042 |
0.84 |
0.45 |
| NMeFOSE |
0.055 |
1.10 |
3.81 |
| NEtFOSE |
0.055 |
1.10 |
4.84 |
| PFMPA |
0.011 |
0.22 |
1.46 |
| PFMBA |
0.011 |
0.22 |
1.41 |
| PFEESA |
0.011 |
0.22 |
1.17 |
| NFDHA |
0.354 |
7.08 |
0.75 |
| 9Cl-PF3ONS |
0.022 |
0.44 |
1.38 |
| 11Cl-PF3OUdS |
0.022 |
0.44 |
1.67 |
| HFPO-DA |
0.173 |
3.46 |
0.51 |
| ADONA |
0.022 |
0.44 |
0.50 |
| 3:3FTCA |
0.222 |
4.44 |
2.47 |
| 5:3FTCA |
0.146 |
2.92 |
9.59 |
| 7:3FTCA |
0.146 |
2.92 |
8.71 |
a. Instrument LOQ was determined using the signal-to-noise ratio (S/N) of the peak from the lowest calibration standard (5-354 ng/L) that had (S/N) ≥ 10.
b. Method Detection Limit (MDL) is estimated and calculated by multiplying the Instrument LOQ by 5/250 to account for the 250 to 5 sample concentration from
the SPE extraction. LOQ cannot be used as MDL but provides an estimate of instrument sensitivity.
Field Sample Analysis
Field samples of non-potable water were gathered from two distinct sources in the New England Area and labeled S1 and S2. Lab-grade reagent water was also included. Four field samples were taken from each location.
Before extraction, all samples were spiked with a uniform concentration of EIS, and two field samples were fortified with method analytes at a concentration of ~4.0 ng/L and ~16.0 ng/L, yielding two field samples and two laboratory-fortified sample matrix (LFSM) samples from each location.
Based on the current EPA-suggested maximum contamination limit (MCL) for PFOA and PFOS in drinking water, a low spiking level of 4.0 ng/L was selected. All samples collected from a single area were then extracted using SPE.
Each sample’s last aliquot of extract was spiked with NIS before being moved to a polypropylene vial for LC/MS/MS analysis.
The field samples (method blanks) were analyzed to ensure that all analytes were either absent or had amounts less than the estimated method limit (ML), as required by EPA method 1633 section 9.5.
For informational purposes, all samples contained trace amounts of 4:2FTS, 6:2FTS, 5:3FTCA, 7:3FTCA, and PFHxS at levels below ML. Figure 7 illustrates the recovery data for target analytes in duplicate samples at two distinct levels. The LFSM% recoveries were within the method requirements of ≥70% and ≤130%.
Figure 8 shows the recovery data for all extracted internal standards analytes spiked into eight samples, exhibiting high extraction efficiency.
Recoveries in aqueous samples met or exceeded the EPA 1633 stated recoveries for all target analytes and extracted internal standards. All computations were carried out according to the method definitions.
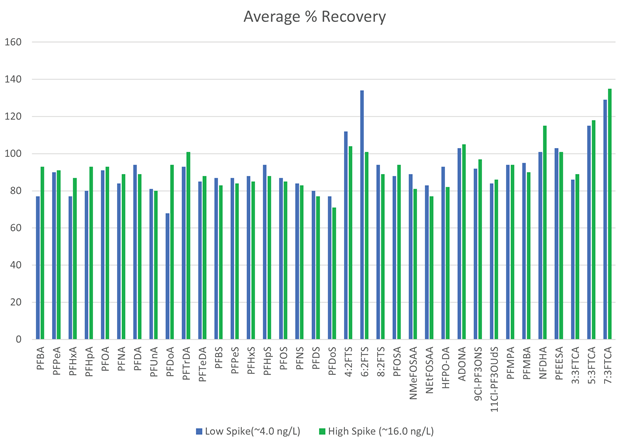
Figure 7. PFAS target analyte recovery data for two aqueous samples spiked at 2 levels. Duplicate samples were extracted at each fortification level. NMeFOSA, NEtFOSA, NMeFOSE, and NEtFOSE were not included in this evaluation. Image Credit: PerkinElmer
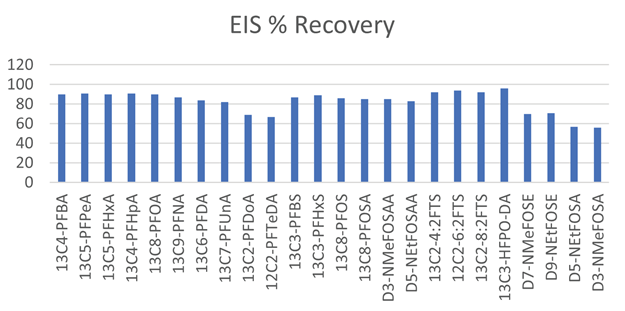
Figure 8. PFAS extracted isotopically labeled standards recovery data for eight spiked aqueous samples. 4 250 mL bottles were extracted for each field sample. Image Credit: PerkinElmer
Conclusion
This article shows how to use the PerkinElmer QSight 420 LC/MS/MS System to optimize an LC/MS/MS technique for determining PFAS analytes and isotopically labeled standards in aqueous samples according to the US EPA Method 1633. Optimization targeted at reducing background PFAS contamination while increasing lab productivity.
The results show excellent linearity for all 40 target PFAS analytes, utilizing extracted isotopically labeled standards, with R2 values ≥ 0.99, and RSE ≤ 20%. In addition, the LOQs obtained with the QSight 420 demonstrate appropriate sensitivity to quantify the PFAS analytes mentioned in US EPA Method 1633.
All target analytes were recovered, and the extracted isotopically tagged standards met the current EPA method 1633 requirements for aqueous samples. Recoveries exceeded the levels reported in the fourth draft of EPA 1633.
Instrument adjustments and the addition of a delay column are required to eliminate or reduce background PFAS contamination, and blank analysis has shown their effectiveness.
The current study's SPE extraction was performed using a manual SPE manifold system modified to remove any PTFE components to reduce or eliminate PFAS contamination. Method MDLs were determined using the signal-to-noise ratios of serially diluted reference standards.
A better chromatographic approach was previously established for EPA Method 537.1 and 533. This same 10-minute LC/MS/MS method was utilized to develop method development of EPA 1633.
In general, this verification study shows that QSight 420 LC/MS/MS System is an effective analytical instrument for the use of EPA Method 1633, with sufficient sensitivity to detect all analytes.
In addition, a singular method, which included the use of the same columns and mobile phases, was validated for the analysis of all analytes from EPA Method 533, 537.1, and 1633 without the need to physically modify the system or consumables other than using a distinct SPE cartridge and preparation method as specified by each methodology.
This will significantly enhance throughput in labs that need to test drinking water and other sample matrices for all three EPA methods analyzing PFAS compounds.
References
- Lau, Christopher, et. al. “Perfluoroalkyl Acids: A Review of Monitoring and Toxicological Findings.” Toxicological Sciences, 99, 2, 2007, pp 366-394. https://pubmed.ncbi.nlm.nih.gov/17519394/
- https://www.epa.gov/pfas/basic-information-pfas
- Wang, Z. et al. “An Overview of the Uses of PFAS.” https://doi.org/10.1039/D0EM00291G
- Boiteux, V.; Bach, C.; Sagres, V.; Hemard, J.; Colin, A.; Rosin, C.; Munoz, J.-F.; Dauchy, X. Analysis of 29 Per- and Polyfluorinated Compounds in Water, Sediment, Soil and Sludge by Liquid Chromatography–Tandem Mass Spectrometry. Int. J. Environ. Anal. Chem. 2016, 96 (8), pp 705–728. https://doi.org/10.1080/03067319.2016.1196683
- Banzhaf, S.; Filipovic, M.; Lewis, J.; Sparrenbom, C.J.; Barthel, R. “A Review of Contamination of Surface-, Ground-, and Drinking Water in Sweden by Perfluoroalkyl and Polyfluoroalkyl Substances (PFASs).” Ambio. Springer Netherlands April 1, 2017, pp 335-346. https://doi.org/10.1007/s13280-016-0848-8
- Lewis, A. J.; Joyce, T.; Hadaya, M.; Ebrahimi, F.; Dragiev, I.; Giardetti, N.; Yang, J.; Fridman, G.; Rabinovich, A.; Fridman, A. A.; McKenzie, E. R.; Sales, C. M. Rapid “Degradation of PFAS in Aqueous Solutions by Reverse Vortex Flow Gliding Arc Plasma.” Environ. Sci. Water Res. Technol. 2020, 6 (4), pp 1044–1057. https://doi.org/10.1039/c9ew01050e
- Buck, R. C.; Franklin, J.; Berger, U.; Conder, J.M.; Cousnis, I.T.; Voogt, P. De’ Jensen, A.A.; Kaanan, K.; Mabury, S.A.; van Leeuwen, S.P.J. “Perfluoroalkyl and Polyfluoroalkyl Substances in the Environment: Terminology, Classification, and Origins.” Integr. Environ. Assess. Manag. 2011, 7(4), pp 513-541. https://setac.onlinelibrary.wiley.com/doi/10.1002/ieam.258#:~:text=(2006)%2C%20the%20presence%20of,of%20larger%20functional%20derivatives%20and
- Parry, E.; Anumol, T. “Quantitative Analysis of PFAS in Drinking Water Using Liquid Chromatography Tandem Mass Spectrometry.” The Column 2019, 15 (5), pp 9–15.
- Shoemaker, J.A.; Tettenhorst, D.R. “EPA Method 537.1: Determination of Selected Per- and Polyfluorinated Alkyl Substances in Drinking Water by Solid Phase Extraction and Liquid Chromatography/Tandem Mass Spectrometry (LC/ MS/MS) Version 2.0” EPA Document #: EPA/600/R-20/006 March 2020.
- Rosenblum, L.; Wendelken, S.C. “EPA Method 533: Determination of Per- and Polyfluoroalkyl Substances in Drinking Water by Isotope Dilution Anion Exchange Solid Phase Extraction and Liquid Chromatography/Tandem Mass Spectrometry Version 1.0” EPA Document #: EPA/815/B-19/020 November 2019.
- Hanley, A.; Burket, S.B.; Strock, T. “4th Draft Method 1633: Analysis of Per- and Polyfluoroalkyl Substances (PFAS) in Aqueous, Solid, Biosolids, and Tissue Samples by LC-MS/ MS” EPA Document #: EPA/821/D-23/001 July 2023.
- “Definition and Procedure for the Determination of the Method Detection Limit, Revision 2” EPA Document #: EPA/821/R-16/006 December 2016

This information has been sourced, reviewed and adapted from materials provided by PerkinElmer.
For more information on this source, please visit PerkinElmer.