Sponsored by PerkinElmerReviewed by Olivia FrostJun 20 2024
Differential scanning calorimetry (DSC) allows users to gain insight into the essential thermal characteristics of polymers, such as details of glass transitions, recrystallization, melting point, and curing.

Image Credit: Shutterstock/Akintevs
When it comes to the characterization of polymers, the PerkinElmer Pyris™ DSC 9 allows for simple, robust solutions for differentiating between grades of the same polymer by utilizing known thermal characteristics.
This study will show how DSC can be used to easily determine the grade of a recycled polyethylene sample and detect the presence of low-concentration polypropylene in recycled polyethylene samples.

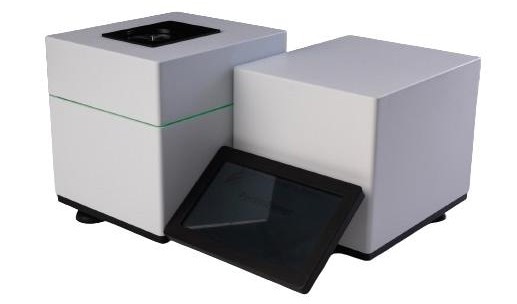
Figure 1. PerkinElmer Pyris™ DSC 9 Differential Scanning Calorimeter and Established PDEs for Elemental Impurities. Image Credit: PerkinElmer
Experimental
5 mg (+/- 0.5 mg) polyethylene samples were cut into a flat shape, providing optimal thermal contact for DSC analysis. Samples were crimped into standard aluminum pans (02190041) before analysis utilizing the DSC 9 differential scanning calorimeter (Figure 1). All samples were measured following this temperature program:
- Hold for 1 minute at 50 °C
- Heat from 50 to 180 °C at 20 °C/minute
- Hold for 1 minute at 50 °C
- Cool from 180 to 50 °C at 20 °C/minute
- Hold for 1 minute at 180 °C
- Heat from 50 to 180 °C at 20 °C/minute
This method requires initial heating of all samples beyond their melting temperature, followed by cooling at a controlled, consistent rate.
This accomplishes two essential tasks. The first is making sure there is optimum thermal contact between the pan and the sample. The second is the ‘erasing’ of any thermal history the sample might contain due to previous processing. The result is much more comparable results than would otherwise be available.
Results and Discussion
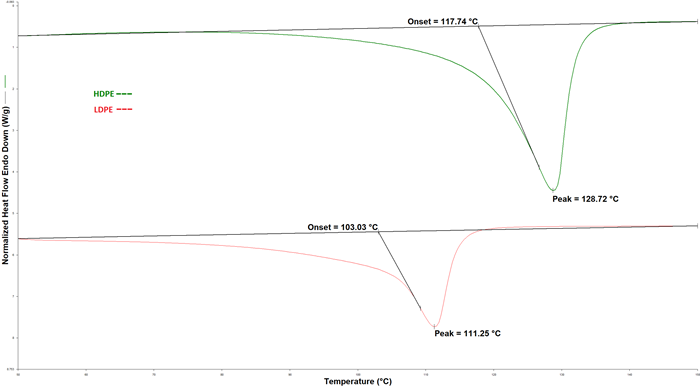
DSC analysis results from virgin low-density polyethylene (LDPE) and high-density polyethylene (HDPE) are showcased in Figure 2. For these samples, the melting onset and peak melting temperatures were calculated using Pyris™ software.
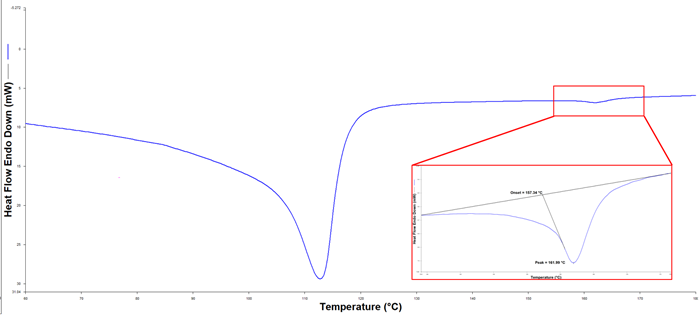
This data can be referenced to determine the grade of an unknown polyethylene sample. Figure 3 indicates the data gained using a sample of polyethylene with an unknown grade.

Figure 2. DSC results from virgin polyethylene samples. Image Credit: PerkinElmer

Figure 3. DSC data obtained from a recycled polyethylene sample. Image Credit: PerkinElmer
Pyris software enables users to set tolerance test limits. In this example, the limit can be set for anything with a melt onset temperature above 117 °C (as found from analysis of the virgin polymer) to be classified as HDPE. This offers an easy and efficient method for fast determination of the polyethylene grade.
From this data, you can determine the grade of polyethylene by examining the melting onset temperature. The onset at 101 ℃ indicates the presence of LDPE (Low-Density Polyethylene). Additionally, the data clearly identifies a peak with a melting point of 162 ℃, which aids in the identification process.
Summary
The PerkinElmer Pyris DSC 9 offers a robust, high-performance solution for polymer analysis. Pyris software can be utilized to automate data analysis and give a basic yes or no answer when it comes to the identity of a sample. Additionally, the high sensitivity of DSC enables the detection of contaminant polymers at low concentrations.

Figure 4. DSC data from a sample of recycled polyethylene suspected to contain a small quantity of polypropylene. Image Credit: PerkinElmer

This information has been sourced, reviewed and adapted from materials provided by PerkinElmer.
For more information on this source, please visit PerkinElmer.