For the past 10 years, monitoring ultrapure water (UPW) systems with a legacy standard of 50 nm sensitivity has been successful and efficient. Particle counts at 50 nm are widely used to evaluate UPW cleanliness.
UPW is employed in important applications, particularly for washing and eliminating particles from product surfaces and diluting chemicals used in various processes in the electronics industry. The cleanliness of the UPW is crucial for achieving optimal particle elimination.
The improvement of ultra-filter performance down to sub-nano filtering capabilities frequently produces zero or very near-to-zero particle counts at 50 nm for most modern UPWs in use today.
In recent years, technological advancements have shifted the emphasis on particle reduction at smaller sizes (below 50 nm). Stringent semiconductor product quality standards and reduced design dimensions are needed to fit more transistors into a single chip.
Monitoring UPW at 50 nm is no longer adequate for identifying particle performance between the best and good water systems.
Semiconductor industry specialists are actively exploring whether the effectiveness of sub-nano filtration can be reliably measured using a 50 nm particle counter or if decreasing measurement sensitivity will offer better proof of the filtration’s ability to remove nanoparticles.
Introduction
Semiconductor industry experts have stressed the significance of comprehending nanoparticle contamination in ultrapure water (UPW) manufacturing and delivery. They have also investigated the benefit of monitoring particle baseline at 20 nm over the current 50 nm particle performance of the cutting-edge UPW system.
Many intriguing experiments in this domain revolve around the motivations for studying the utility of monitoring particle size down to 20 nm at the UPW system. Investigating this aspect aims to open new avenues for enhanced particle monitoring and practical applications.
This article presents different case studies of monitoring approaches used in advanced UPW systems. It also discusses if detecting at 20 nm could improve the legacy monitoring standard at 50 nm.
Typical Liquid Particle Size Distributions
The particle size distribution in filtered liquids may be calculated theoretically using a power-law distribution. The number of particles is inversely related to their size (x-ʸ, represented in Figure 1 below as x-y), where y is often close to 3. For a theoretical estimation using power-law distribution:
- Assume the particle concentration of a UPW system at 100 nm is 0.1 counts per milliliter
- Using a power-law distribution, we may extrapolate the value of y for different exponents to forecast the particle counts at 20 nm
- The estimated particle size distribution is depicted in Figure 1

Figure 1. Particle size distributions. Image Credit: Particle Measuring Systems
Table 1. Particle size (nm) distribution using power law (extrapolated at 100 nm using 0.1 counts/ml). Source: Particle Measuring Systems
| Exponent |
20 |
50 |
70 |
100 |
| X-4.5 |
139.7 |
2.3 |
0.5 |
0.1 |
| X-3.0 |
12.5 |
0.8 |
0.3 |
0.1 |
| X-1.5 |
1.1 |
0.3 |
0.2 |
0.1 |
Table 1 depicts the possible misinterpretation of UPW particle performance when comparing two distinct UPW systems with a 50 nm particle counter.
When comparing UPW systems at 20 nm, the difference between UPW system's particle performance becomes more obvious. Comprehending the Particle Size Distribution (PSD) enables improved prediction of the UPW system performance at 20 nm and provides suggestions for quality enhancement.
In general, for 20 nm UPW monitoring, exponent values of 'y' range between 1.5 to 4.5.1 The exponent value of y is determined by the overall control of UPW systems, such as filter efficiency in relation to particle counter sensitivity.
- Filter rated << 20 nm, y often approximates to 3 or smaller; filter rated >> 20 nm, y is more than 3
Sampling Interval with Statistically Significant Particle Data
One of the most crucial aspects of understanding when employing particle counters to monitor UPW systems is determining the shortest sample interval for equipment to deliver statistically significant particle data following industry best practices.
Essentially, two pieces of information are required before determining a good sampling interval:
- First is the instrument’s actual sampled flow rate. Using the UDI-20 as an example, the total flow rate through the instrument is 75 ml/min. Because the UDI-20 is a monitor-type instrument (rather than a volumetric one), the actual measured flow rate is 0.45 ml/min. Therefore, the actual volume of ultrapure water tested in a one-minute sample would be 0.45 ml
- Second is the cleanliness of the ultrapure water sample. A typical high-purity UPW system has 1-5 particles/ml > 20 nm. As shown in Figure 2, a clean ultrapure water supply would reveal less than three particles in one minute
In most circumstances, when working with highly clean UPW systems, a one-minute sample period is insufficient to provide statistically meaningful data. This produces extremely variable data that is difficult to interpret and make decisions.
Table 2. UDI-20 counts per Interval. Source: Particle Measuring Systems
Sample Cleanliness*
(particles/ml) |
1 min |
10 min |
30 min |
60 min |
90 min |
| 0.5 |
0.23 |
2.3 |
6.8 |
13.5 |
20.3 |
| 1 |
0.45 |
4.5 |
13.5 |
27 |
40.5 |
| 5 |
2.25 |
22.5 |
67.5 |
135 |
202.5 |
| 25 |
11.25 |
112.5 |
337.5 |
675 |
1012.5 |
*Particle level (the number of particles per milliliter in the 20 nm size channel)

Figure 2. UDI-20 sample interval versus raw counts. Image Credit: Particle Measuring Systems
A statistically valid number of particles per sample (as defined by a general rule-of-thumb) is when the raw counts are higher than 20. This represents the point at which a normal distribution is about the same as a Poisson distribution.2
For a highly clean UPW supply with less than 5 particles/ml > 20 nm, we would need to sample for at least 10 minutes to get enough counts to claim statistical validity. For less clean UPW (for example, > 25 particles/ ml > 20nm), we would need to sample for at least two minutes to obtain meaningful results.
Ultrapure Water System Applications
Case Study A: Particle Levels at O3 (ozone) Water Generator
This case study employed a single UDI-20 to monitor 20 nm particle levels at various times at three different O3 water generators. The goal was to employ particle data from a narrower channel (20 nm) to improve system performance and troubleshooting.
- Sample monitoring was carried out on O3 water Generators 1 and 2, with low particle counts at 50 nm. As shown in Figure 3, the 20 nm particle level of Generator 2 had lower counts than Generator 1. The differences between the two generators, however, were not noticeable when compared to the data of the 50 nm channel. This suggests that Generator 1 may have included some contamination sources that require additional investigation. When the particle size distributions were computed, Generator 2 was found to have a relatively smaller exponent value (2.276) than Generator 1, which had an exponent value of (2.792).
- A troubleshooting case was conducted on O3 water Generator 3 with high particle counts at the 50 nm channel. Figure 4 shows that the 20 nm channel has distinct particle spikes while the 50 nm channel has no discernible spikes. According to the findings, particle detection with better sensitivity (50 nm decreased to 20 nm) is necessary to discover the system abnormalities.

Figure 3. O3 water generators particle levels at different channels. Image Credit: Particle Measuring Systems

Figure 4. Monitor O3 water generator with particle spikes. Image Credit: Particle Measuring Systems
Case Study B: Particle Levels at Mixed Bed Polisher
In a foundry fab, the particle issues discovered on product wafers after cleaning prompted a study of the UPW system.
After partitioning to identify potential reasons, the particle source was discovered to be associated with a change in quality to the UPW system at the mixed bed polishers before ultra-filtration and water supply to the Point-of-Use for fab processes.
Monitoring with the UDI-50 indicated particle-level variations between the mixed bed polishers in the 50 nm channel. It is intriguing to consider whether a 20 nm channel would reveal more about the problematic source.
- Figure 5 shows that two polishers must be mixed-run due to fab constraints. The different settings affect the particle level at the point of use based on previous experiences with the UDI-50
- The UDI-20 was used to study the particle levels in various configurations (Config 1: mixed bed 1 & 2, Config 2: just mixed bed 1, Config 3: only mixed bed 2)

Figure 5. Monitor scheme of mixed bed polishers & particle counter. Image Credit: Particle Measuring Systems
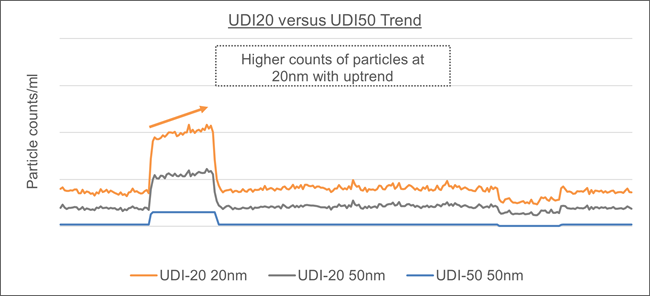
Figure 6. Particle levels of different mixed bed configurations (UDI-20 vs. UDI-50). Image Credit: Particle Measuring Systems
According to the test findings in Figure 6, the data from UDI-20 could clearly distinguish particle levels between three mixed bed polisher setups.
Interestingly, with better sensitivity at 20 nm, a particle rise was noticed at mixed bed polisher 1 that the UDI-50 could not detect. Observing the increase at 20 nm during real-time monitoring enables better control to avoid producing too many nanoparticles in the downstream operations.
Case Study C: Particle Levels at Final Filtration for Filter Comparisons
The UDI-20 was used to assess final ultra-filtration and compare the performance of two distinct filter types. Each new filter type was fitted separately to describe particle levels at 20 nm, as shown in Figure 7.
- Figure 8 shows that Filter B outperformed Filter A at 20 nm particle counts by at least twofold. In addition, Filter B took more than three days to establish a steady-state particle level at 20 nm, but Filter A took half that time
- When comparing filters with sub-10 nm pore sizes, monitoring the particle size down to the 20 nm channel becomes more significant and gives a greater resolution to discern particle levels

Figure 7. Location of filters A and B in system. Image Credit: Particle Measuring Systems

Figure 8. 20 nm particle levels of filter A versus filter B. Image Credit: Particle Measuring Systems
Case Study D: Particle Level at Final Filtration for Sensitivity Comparisons (UDI-20 vs. UDI-50)
This study is comparable to Case Study C. The final filtration (sub-10 nm pore size) was measured using DI-50 and UDI-20 to better understand the variations in particle levels in a highly clean UPW system.
As seen in Figure 10, the 20 nm spike event is not apparent at the 50 nm channel because most particles larger than 50 nm have been eliminated. Particles smaller than 50 nm may go undetected by the UDI-50 detector.
To achieve adequate control over UPW systems, the UDI-20’s sensitivity must be increased to enhance detection.
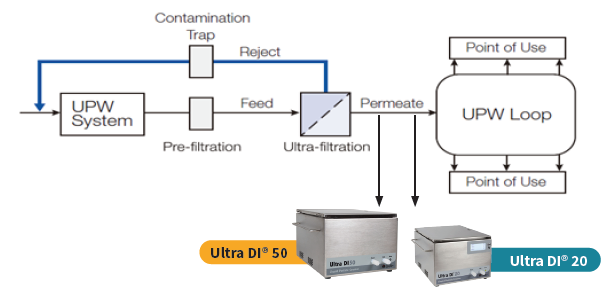
Figure 9. Location of filters in UPW system. Image Credit: Particle Measuring Systems

Figure 10. Monitoring (UDI-20 vs. UDI-50) At UPW system (Ultra filtration). Image Credit: Particle Measuring Systems
Case Study E: Particle Monitor at Point-of-Use
The UDI-20 was placed in a specified area of the UPW system (also known as the Point-of-Use) and measured particles for five days.
- Figure 11 shows that the particle trend remained steady for the first three days. On Days 4 and 5, particle events were found exclusively at 20 nm, with a relatively stable trend at other channels
- Additional analysis was performed to overlay the five days' data. Coincidentally, it was discovered that 20 nm particle events happened at a specified time frame, as seen in Figure 12. These are actionable results, offering indications for additional studies to comprehend any activity at that exact time frame when the spikes in particles occurred

Figure 11. Monitoring 20 nm particle performance at ultrapure water system (Point-of-use). Image Credit: Particle Measuring Systems

Figure 12. Overlaying daily (5-days) particle trend. Image Credit: Particle Measuring Systems
Cartridge Filter Age Study F
A single UDI-20 and UDI-50 were used to determine the particle baseline at each filter housing. The investigation was conducted without knowing the filter’s age. Particles were also detected at the system’s common feed point.
- As seen in Figure 14, reordering the particle dataset by filter age reveals a strong correlation with filter life. Multiple cartridge filters were investigated at the age of four months and two months, with a high level of consistency.
- The cartridge filters aged one to six months showed a twelve-fold rise in the 20 nm channel, whereas the 50 nm channel began to increase at six months. The particle level exceeded the 20 nm baseline in one month.

Figure 13. Sequence of cartridge filters. Image Credit: Particle Measuring Systems

Figure 14. Cartridge filters testing results. Image Credit: Particle Measuring Systems
Figure 15 shows that different bin sizes may characterize the total cartridge filtration system efficiency (20-50 nm; 50-70 nm; 70-100 nm; 100 nm). According to UDI-20 data, good filter efficiency (>95%) was obtained, with the 20-50 nm bin size showing a lower efficiency (95.63%) than other bins (>99%).

Figure 15. Overall cartridge filter efficiency. Image Credit: Particle Measuring Systems
As the filter ages, its efficiency decreases significantly with decreasing particle size. Figure 16 shows that the filter efficiency drops from 94% to 76% at 20-50 nm after one to six months of usage. This performance loss by the six-month housing explains the 20-50 nm reduction in the overall filtration efficiency, as shown in Figure 15.

Figure 16. Filter efficiency age effect by particle size. Image Credit: Particle Measuring Systems
Ultra-Filter Age Study G
The particle baseline was measured blindly with a single UDI-20 at three chosen ultra-filter skids representing a complete range of filter ages (two, four, and six years). Rearranging the baseline values by filter age revealed a substantial association with filter life, as seen in Figure 17.

Figure 17. Ultrafilters testing results. Image Credit: Particle Measuring Systems
The above study on Cartridge Filters and Ultra-Filters sheds light on several testing methods for understanding particle levels. When monitoring particles at 20 nm, filter performance is easily detected and tracked.
The Cartridge Filter’s performance improvements are only noticeable at 50 nm. After a 1200% increase in 20 nm, contamination was detected following six months of usage.
Summary
Seven case studies in this article demonstrated the benefits of monitoring particles at 20 nm rather than 50 nm. Because of advancements in filtration technology used in UPW systems and focusing on reducing nanoparticle counts, monitoring at 50 nm is no longer sufficient.
As case studies A through E illustrate, good monitoring is critical for ensuring proper control, continuous improvement, and troubleshooting in UPW systems.
Case studies F & G exhibit the polish cartridge’s performance, with ultrafilters forming depending on the usage period. This suggests that switching from a time-based to a quality-based approach to filter maintenance can enhance the process.
References
- Knollenberg, R.G., Veal, D.L., Optical Particle Monitors, Counters, and Spectrometers: Performance Characterization, Comparison and Use. Proceedings of the 37th Annual Technical Meeting of the Institutes of Environmental Sciences, May 1991.
- Mitchell, J., Bast, B., Comparing Particle Counter Performance Characteristics for Analyzing High-Purity Water, Ultrapure Water Journal, February 2000.

This information has been sourced, reviewed and adapted from materials provided by Particle Measuring Systems.
For more information on this source, please visit Particle Measuring Systems.