The use of liquefied natural gas (LNG) as a fuel is a crucial element in global decarbonization efforts. In regions where gas transport infrastructure is insufficient, such as Japan, transporting natural gas from LNG import terminals to end users presents significant challenges. To address this, many areas have adopted LNG transport by truck and established satellite storage facilities to serve these customers.
Specialized trucks or ISO containers on flatbed trucks transport natural gas, which is then stored in tanks at these facilities. Even in regions with well-developed gas infrastructure, satellite facilities play a vital role in "peak shaving," storing LNG for injection into the local gas grid during periods of high demand.

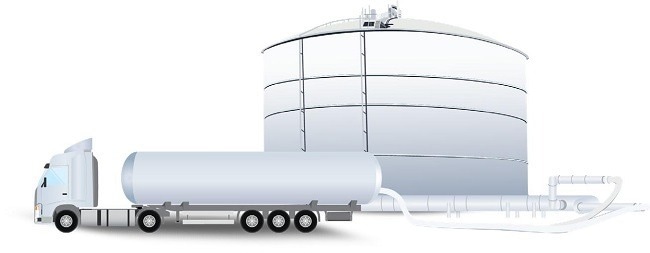
Figure 1. LNG truck loading at a peak shaving plant. Image Credit: Endress+Hauser
Benefits at a Glance
- No requirement for a vaporizer - assesses LNG in situ in the cryogenic liquid phase
- Simple analyzer installation in the control room – no need for a dedicated room for analysis
- Cheaper installation – no requirement for vacuum-jacketed tubing to transport samples
- Pilot-E probe (C1D1/Zone 0) installed up to 500 m from the analyzer
- No delays in assessment stemming from sample transport or vaporization
- Practically immune to variations in LNG flow
- Reduced OPEX – no moving parts or consumables
- Removes up to 2-hour temperature stabilization needed by some vaporizers
Measurement of Btu
LNG delivered to a satellite storage facility requires a custody transfer to the receiving facility. The total energy transferred must be determined as part of the transaction. Many truck facilities make use of scales to find out the mass of the LNG transferred or can use mass flow meters or volumetric flow meters together with a density measurement of the LNG.
To identify the energy transferred, the quality or calorific value of the LNG delivered should also be assessed. LNG quality may be established in either the liquid phase via Raman spectroscopy or the gaseous phase via gas chromatography (GC) following sample vaporization.
Issues with Traditional Measurements
Traditionally, LNG composition at truck loading facilities has been measured using GC. Before analysis, a representative sample of the LNG must be converted from its cryogenic liquid state to a room-temperature gas through vaporization.
However, improper vaporization—often caused by partial or pre-vaporization of the LNG sample—is the primary source of uncertainty in determining LNG composition. When this occurs, the gas sample may not accurately reflect the LNG's actual composition, leading to increased uncertainty in the measured energy content transferred.
Vaporization systems are particularly sensitive to LNG flow rates, and any fluctuations during transfer can result in inaccurate energy calculations. Moreover, given that a typical transaction volume is around 60 m3, most truck loadings are completed within thirty to sixty minutes, with significant intervals between loadings. An LNG vaporizer may require two or more hours to stabilize when exposed to LNG before the transfer can begin, leading to unnecessary delays and increased costs.
By eliminating the vaporization step, using Raman spectroscopy to measure LNG in its cryogenic liquid state significantly enhances both the efficiency and quality of the LNG measurement process.

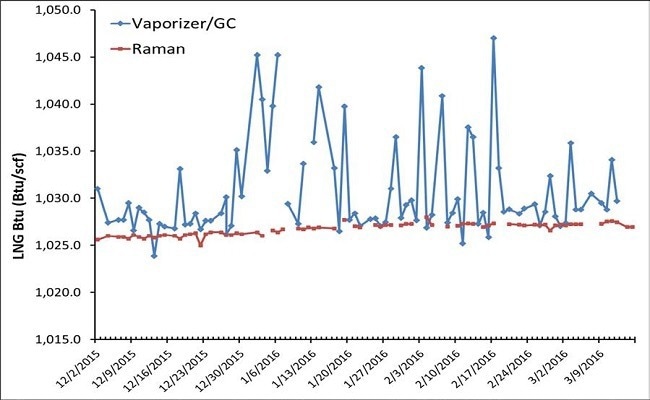
Figure 2. Comparison of Raman and GC/vaporizer measurements of multiple LNG truck loading events from one storage tank over a period of three months. Image Credit: Endress+Hauser
Raman Rxn4 Analyzer for LNG Truck Loading
The Raman Rxn4 analyzer for LNG with the Rxn-41 probe for cryogenic service delivers a precise assessment of the composition and calorific value of LNG, with up to 10 times less uncertainty than the GC-vaporizer system.
As shown in Figure 2, the Raman measurement is not affected by vaporization errors, which can lead to up to a 2 % error in energy content when using the vaporizer/GC method. The stability of the Raman measurement ensures both the buyer and seller an accurate and precise assessment of the entire LNG cargo during custody transfer.
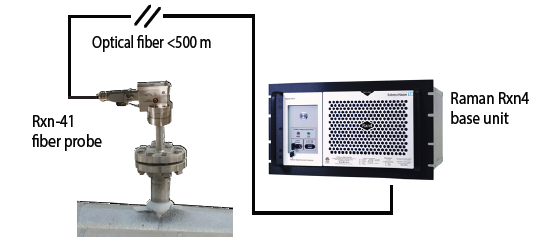
The rack-mounted Raman Rxn4 analyzer is easy to install in an existing control room, with fiber optic coupling to the Rxn-41 probe mounted in the LNG pipe for in situ assessment in the liquid phase, removing sample conditioning or transport. This means that no sample is missing or requires flaring.
Raman analyzers have very low maintenance needs as they have no moving parts or consumables. Virtually zero time removes up to two hours of cool-down stabilization needed by some vaporizers; assessment begins when the LNG flows.
The Raman Rxn4 analyzer for LNG truck loading includes:
- Raman Rxn4 base unit with integrated and automated calibration
- Rxn-41 fiber optic probe for cryogenic service
- Fiber optic cable length of 15 to 500 meters, tailored to the client's needs
- Special LNG custody transfer approach valid over LNG temperature between 93 K to 117 K*
*Requires manual entry for fixed temperature or temperature input (±1 K) via Modbus for varying temperature
Table 1. Range of validated LNG with worst case uncertainty for fiber lengths < 500 m and measurement time of 300 seconds**. Source: Endress+Hauser
| LNG component ranges and performance |
| Component |
Concentration (Mol %) |
Uncertainty (k=2) |
| Min |
Max |
| Methane (CH₄) |
87.000 |
98.170 |
< 0.46 |
| Ethane (C2H6) |
1.300 |
10.500 |
< 0.38 |
| Propane (C3H8) |
0.160 |
3.000 |
< 0.11 |
| i-Butane (iC4H10) |
0.060 |
0.400 |
< 0.023 |
| n-Butane (nC4H10) |
0.078 |
0.600 |
< 0.028 |
| i-Pentane (iC5H12) |
0.005 |
0.120 |
< 0.031 |
| n-Pentane (nC5H12) |
0.005 |
0.120 |
< 0.015 |
| Nitrogen (N2) |
0.040 |
1.050 |
< 0.056 |
Table 2. Range of validated LNG heating values with worst case uncertainties for fiber lengths < 500 m and measurement time of 300 seconds**. Source: Endress+Hauser
| Component |
Range Min – Max |
Uncertainty (k=2) |
| Gross heating value (MJ/m3) |
38.4 - 42.2 |
< 0.16 |
| Gross heating value (MJ/kg) |
53.8 - 55.3 |
< 0.072 |

Figure 3. Recommended direct flange mounted installation. Image Credit: Endress+Hauser
**Performance may vary for different cable lengths and analysis times.

This information has been sourced, reviewed and adapted from materials provided by Endress+Hauser.
For more information on this source, please visit Endress+Hauser.