Introduction
Titanium Dioxide has been utilized as a pigment and opacifier in various industries for several years, owing to its bright white color and high refractive index. However, handling Titanium Dioxide in its powdered form presents significant challenges due to its high cohesivity. Specific measures typically need to be put in place when handling this substance during operations, like dispensing from hoppers, feeding into processing units, and blending with other powders.
Distinguishing and quantifying which powder characteristics contribute to effective processing permits new formulations to be optimized without the high costs of running samples through the process to measure suitability. This leads to significant savings in time and raw materials and minimizes waste from out-of-spec products.

Image Credit: AB-7272/Shutterstock.com
Assessing Batch-To-Batch Variability
Although three batches of Titanium Dioxide met existing specifications, they exhibited significantly different behavior when used in the same process, leading to unacceptable variations in the final product quality. Traditional characterization techniques were applied but failed to distinguish between the batches, partly due to the high variability in the test results.
Samples from these batches were analyzed using an FT4 Powder Rheometer®, which revealed clear and repeatable variation between them. This analysis explained the variations in process performance and allowed the user to reliably assess the quality of incoming batches in terms of their relevance to the process.
Test Results
Dynamic Testing: Basic Flowability Energy
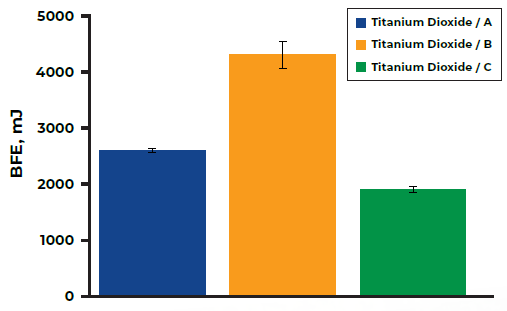
Sample B exhibited the highest BFE among the three materials, while Sample C showed the lowest. In this context, a high BFE indicates a more efficiently packed powder bed, meaning the blade has to displace more powder as it moves, with less space available for particles to shift into. This requires more energy to mobilize the bed, suggesting that the powder might be challenging under dynamic, forced flow conditions, such as those encountered in a screw feeder.

Image Credit: Micromeritics Instrument Corporation
Bulk Testing: Permeability
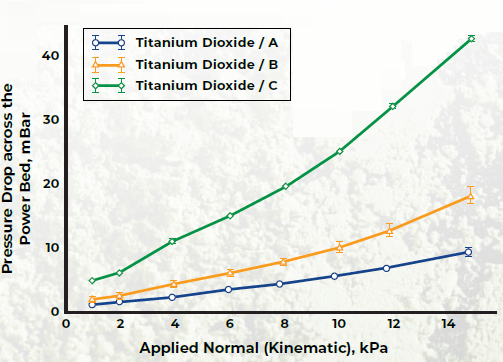
Sample B produced the lowest pressure drop among the three materials, while Sample C exhibited the highest. A high pressure Drop indicates greater resistance to airflow through the sample, meaning lower permeability. The lower Pressure Drop (and thus higher permeability) observed for Sample B is characteristic of the uniform structure formed by an efficiently packed bed. This is often linked to improved gravitational flow in low-stress environments, such as during filling operations.

Image Credit: Micromeritics Instrument Corporation
Shear Cell Testing
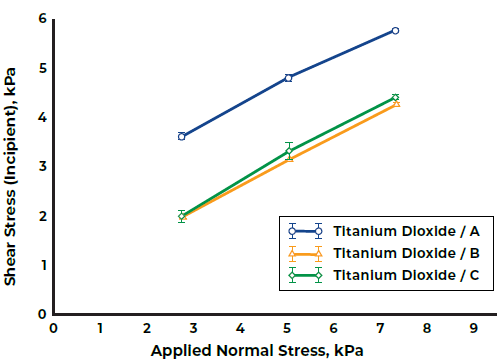
A different pattern emerged in the shear cell results, reflecting the distinct stress and flow conditions that this test method establishes. Shear Cell tests are designed to simulate the high-stress, static environments found in operations like gravitational hopper discharge.
Sample A produced considerably larger shear stress values than the other two samples, suggesting that it is significantly more resistant to incipient flow—the transition from a static to dynamic state—after storage under consolidation. Samples B and C produced similar shear stress values, meaning that they would perform similarly under the same conditions.

Image Credit: Micromeritics Instrument Corporation
Conclusion
The FT4 Powder Rheometer® has quantified clear and repeatable variations between the three samples in terms of dynamic, bulk, and shear properties. Sample B exhibited the highest basic flowability energy (BFE) and permeability values, along with low shear stress values, indicating that it would perform very differently from the other samples.
The findings for samples A and C indicate that they would have more cohesive behavior than Sample B over a spectrum of processes; Sample C produced the lowest BFE and permeability values, suggesting the highest cohesive behavior in lower-stress processes like blending and filling; and Sample A produced the largest shear stress values, suggesting that this would offer the highest levels of resistance to flow in high-stress functions like hopper discharge.
Powder flowability is not an intrinsic property of materials and is more about the capability of powder to flow in the appropriate manner in a certain piece of equipment. Successful processing requires that the powder and the process are compatible, and it is not uncommon for the same powder to perform well in one process and not another.
This necessitates multiple characterization methodologies, with results that can be correlated with process rankings to create a design space of parameters corresponding to acceptable process behavior. Instead of relying on a single measurement to describe behavior across all processes, the FT4’s multivariate approach simulates a range of unit operations, allowing for the direct examination of a powder’s response to diverse process and environmental conditions.

This information has been sourced, reviewed and adapted from materials provided by Micromeritics Instrument Corporation.
For more information on this source, please visit Micromeritics Instrument Corporation.