Hydraulic fracturing, also known as fracking, is a procedure that extracts oil and natural gas by injecting a high-pressure fluid containing water, proppants, and additives. The high pressure of the fracking fluid causes artificial fissures or breaks in subterranean oil and gas-bearing rocks, allowing oil and/or natural gas to flow freely.1
Following fracking, the flow direction of the fracking fluid reverses, flushing salts, elements, and hydrocarbons from the geological formation. Fracturing fluids are mostly composed of water and are classified according to the fracturing stage.
The fracking fluid is made with fresh water from several sources, including drinking water, surface water, groundwater, and recycled produced water.
Produced water is a mixture of flowback and formation water that rises to the surface alongside oil and natural gas. Flowback water is fracked water that returns after fracking, whereas formation water is water that naturally occurs in geological formations.
It is critical to study the composition of fracking fluids to investigate additive performance for optimizing the extraction process, determine recyclability for lowering operational costs, and limit potential effects on ecosystems for safe disposal.2
The large amounts of total dissolved solids leached from geological formations, which can reach 30 g/L, interfere with signals from key analytes. Furthermore, these fluids are susceptible to high organic and particle pollution.
Dilution is widely used for these types of samples; nevertheless, a valid analysis over a dilution range must be addressed, especially when dealing with concentrations varying from trace to substantial levels. In addition to these issues, modern water management strategies that recycle and reuse produced water will likely raise analytical requirements.
This article proposes a technique for analyzing fracking fluids with the PlasmaQuant 9100 Elite inductively coupled plasma optical emission spectrometer (ICP-OES). This investigation's fresh and processed water samples came from the Permian basin in Texas, United States.
To correctly quantify concentrations in the range of µg/L to g/L, having a robust plasma and a wide working range is crucial, as the composition of fracking fluids varies by geological site.3
Materials & Methods
Samples and Reagents
Figure 1 depicts fracking fluid samples. Samples iii and v are freshwater, whereas samples i, ii, and iv are produced water.
Samples i and ii were significantly polluted with particles and residual organic material, respectively. Before analysis, the samples were thoroughly shaken by hand and vortexed for 10 seconds each to achieve homogeneity.
Aliquots of the samples were taken beneath any organic layer and diluted tenfold with 2.5 % HNO3. An internal standard of 1.0 mg/L yttrium (Y) in 2.5 % HNO3 was added online with a Y-piece just before the nebulizer. After obtaining the samples, a two-point calibration curve was used to estimate the concentration of components.
Samples iii and v were analyzed directly, whereas samples i, ii, and iv were diluted to 10, 50, 100, and 500 times. VWRTM provided nitric acid (67–70 %), ASTM type II water, and single-element standards. Matrix Reference Materials SCP Science provided EnvironMAT drinking water and EnvironMAT wastewater.
Calibration
Single-element standard solutions were used to make multi-element standard solutions in a 2.5 % (v/v) HNO3 matrix. Table 1 lists the concentrations of the calibration standards. Figure 2 shows calibration curves with R2 values greater than 0.999.
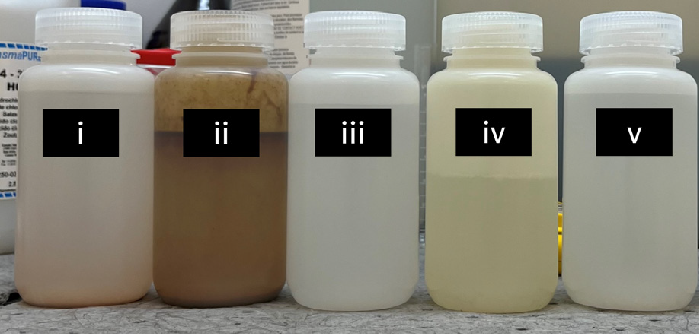
Figure 1. Samples labelled iii, and v are fresh waters while samples labelled i, ii, and iv are produced waters. Image Credit: Analytik Jena US
Instrument Settings
The elemental analyses were performed on a PlasmaQuant 9100 Elite ICP-OES with the system configuration shown in Table 2. The instrument was outfitted with a salt kit introduction system, including a glass concentric SeaSpray™ nebulizer, a cyclonic spray chamber with a dip tube, and a 2 mm inner diameter injector tube.
A Teledyne Cetac ASX 560 autosampler was also utilized. The method parameters are listed in Table 3. The PlasmaQuant 9100 Elite ICP-OES includes axial plus and radial plus observation modes, which attenuate the signal in the respective view and allow for a larger linear dynamic range.
Table 1. Concentration of calibration standards. Source: Analytik Jena US
| Element |
Unit |
Cal. 0 |
Std. 1 |
Std. 2 |
Std. 3 |
Std. 4 |
Std. 5 |
Std. 6 |
| B, Ba, Mg |
mg/L |
0 |
0.1 |
0.5 |
1 |
5 |
- |
- |
| Fe, Mn, Zn, P, Li |
mg/L |
0 |
0.1 |
0.5 |
1 |
5 |
10 |
- |
| Ca, K, Na, Sr |
mg/L |
0 |
- |
- |
1 |
5 |
10 |
50 |
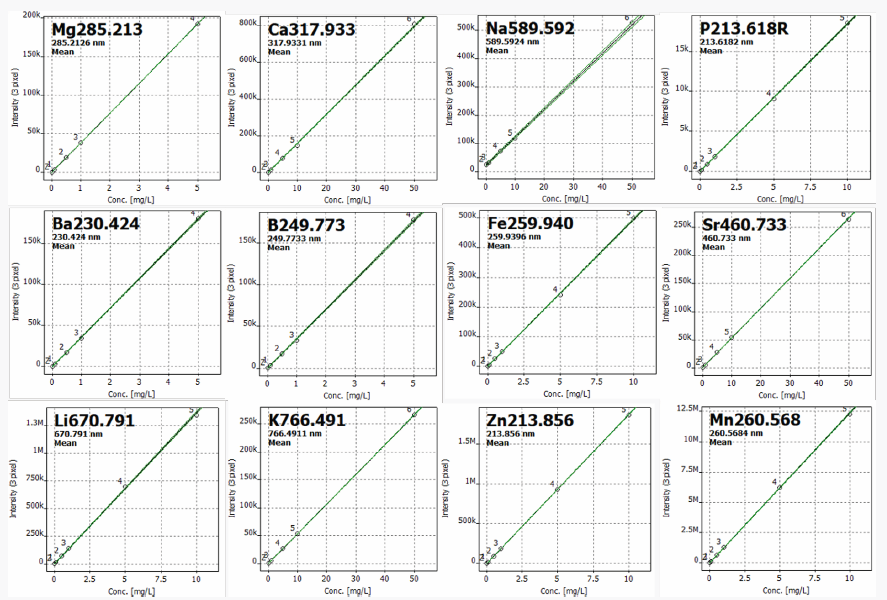
Figure 2. Calibration curves (black lines) with confidence levels (green line) of elements in this analysis. Image Credit: Analytik Jena US
Table 2. Plasma configuration and sample introduction system. Source: Analytik Jena US
| Parameter |
Specification |
| Power |
1,200 W |
| Plasma gas flow |
13.5 L/min |
| Auxillary gas flow |
0.5 L/min |
| Nebulizer gas flow |
0.5 L/min |
| Nebulizer |
Concentric, SeaSpray™, 2.0 mL/min, Borosilicate |
| Spray chamber |
Cyclonic spray chamber with dip tube1, 50 mL, borosilicate |
| Injector |
Quartz, inner diameter 2 mm |
| Outer tube / Inner tube |
Syalon2 / Quartz |
| Pumping tubing |
PVC |
| Sample pump rate |
1.0 mL/min |
| Fast pump rate |
2.0 mL/min |
| Torch Position |
-1 mm |
| Rinse / Read delay |
60 s / 60 s |
| Auto sampler |
ASX 560 |
1 … the dip tube geometry improves precision for high matrix-loadings
2 … ceramic outer tube prolongs the life-time of torch in sodium-rich matrices
Method Parameters
Table 3. Overview of method-specific evaluation parameters. Source: Analytik Jena US
| Element |
Line
[nm] |
Plasma
view |
Integration
mode |
Read
time [s] |
Evaluation |
No. of
Pixel |
Baselin fit,
No. of Pixel |
Polyn
Degree |
Correction |
| Ar1 |
420.068 |
Radial |
Peak |
3 |
3 |
ABC |
Auto |
‒ |
| Y2 |
371.030 |
Radial
Radial Plus
Axial |
Peak |
3 |
3 |
ABC
ABC
ABC |
Auto
Auto
Auto |
‒
‒
‒ |
| B |
249.773 |
Radial |
Peak |
3 |
3 |
ABC |
Auto |
Y4 |
| Ba |
230.424 |
Radial |
Peak |
3 |
3 |
ABC |
Auto |
Y |
| Ca |
317.933 |
Radial |
Peak |
3 |
3 |
ABC |
Auto |
Y |
| Fe |
259.940 |
Radial plus |
Peak |
3 |
3 |
ABC |
Auto |
Y |
| K |
766.491 |
Radial |
Peak |
3 |
3 |
ABC |
Auto |
Y |
| Li |
670.791 |
Radial |
Peak |
3 |
3 |
ABC |
Auto |
Y |
| Mg |
285.213 |
Radial plus |
Peak |
3 |
3 |
ABC |
Auto |
Y |
| Mn |
260.568 |
Axial |
Peak |
3 |
3 |
ABC |
Auto |
Y |
| Na |
589.592 |
Radial plus |
Peak |
3 |
3 |
ABC |
Auto |
Y |
| P |
213.618 |
Radial |
Peak |
3 |
3 |
ABC |
Auto |
Y |
| Sr |
460.733 |
Radial |
Peak |
3 |
3 |
ABC |
Auto |
Y |
| Zn |
213.856 |
Axial |
Peak |
3 |
3 |
ABC |
Auto |
Y |
1 … monitored to check plasma stability
2 … internal standard
3 … automatic baseline correction (ABC)
4 … correction by internal standard yttrium (Y); no mathematical correction of spectral interferences by CSI tool required
Results and Discussion
Sensitivity, Resolution, and Method Validation
Table 4 displays the acquired limits of detection (LOD) and quantitation (LOQ). The LODs were computed by multiplying the standard deviation of 11 blank solutions by three, and the LOQs were the values obtained by multiplying the LODs by three.
All elements have LODs of less than 1 mg/L. Except for salt (Na), LOQs are less than 1 mg/L. Because sodium concentration is often high in fracking fluids, a 1.5 mg/L LOQ for sodium is more than adequate.4 The PlasmaQuant 9100 Elite currently provides the best spectral resolution on the market.5
Figure 3 shows isotopic information for lithium (Li). The uneven form of the peak at 670.971 nm results from the convoluted signal of Li-7 and Li-6 isotopes.6
Although obtaining a certified reference material (CRM) has been a challenge for this industry, owing to differences in the composition of fracking fluids across geographical areas, method validation is accomplished by spiking samples and evaluating recoveries.
Closely related certified reference material has been shown to evaluate the analytical performance of the approach and instrument.7
This study used drinking water and wastewater CRMs, as illustrated in Figure 4, panels A and B, respectively. All measured values were within ± 20 % of the certified values. CRMs were measured before and during sample runs to establish procedure validity.
Fracking Fluid Analysis
After determining sensitivity, resolution, and method validation, fracking fluid samples were measured, and the findings are displayed in Table 5. Relative standard deviation (RSD) values for all samples and elements were less than 3 %, indicating good precision.
The PlasmaQuant 9100 Elite’s dual view feature ensures accurate analysis of components with concentrations ranging from µg/L to mg/L. For example, boron (B) content was measured with excellent precision in both generated and frack waters at high and low concentration levels, respectively.
Boron content is related to cross-linker molecules that modify the rheological properties of the fracking fluid, and it is critical in defining the fracking fluid’s reusable nature.8
The measured values of calcium (Ca), potassium (K), sodium (Na), strontium (Sr), and magnesium (Mg) all show high precision at g/L concentration.
Table 4. Acquired limit of detection (LOD) and limit of quantification (LOQ).Source: Analytik Jena US
| Element |
Line
[nm] |
Limit of
detection
[mg/L] |
Limit of
quantification
[mg/L] |
| B |
249.773 |
0.0084 |
0.0253 |
| Ba |
230.424 |
0.0011 |
0.0033 |
| Ca |
317.933 |
0.0026 |
0.0078 |
| Fe |
259.940 |
0.0014 |
0.0043 |
| K |
766.491 |
0.8210 |
0.2464 |
| Li |
670.791 |
0.0016 |
0.0048 |
| Mg |
285.213 |
0.0018 |
0.0054 |
| Mn |
260.568 |
0.0002 |
0.0007 |
| Na |
589.592 |
0.4987 |
1.4963 |
| P |
213.618 |
0.0418 |
0.1254 |
| Sr |
460.733 |
0.0192 |
0.0577 |
| Zn |
213.856 |
0.0005 |
0.0015 |
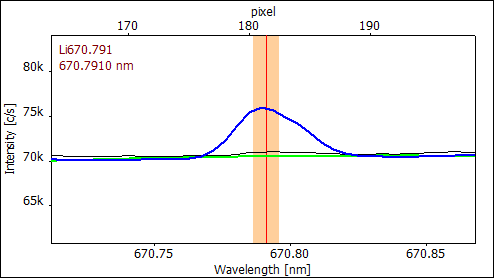
Figure 3. Lithium spectrum showing asymmetric properties due to the convoluted peaks of Li-7 and Li-6 isotopes. Image Credit: Analytik Jena US
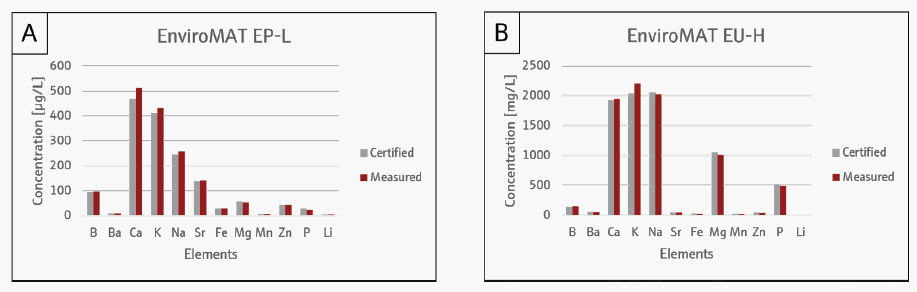
Figure 4. Elemental analyses of (A) EnviroMAT EP-L drinking water and (B) EnviroMAT EU-H wastewater certified reference material. Image Credit: Analytik Jena US
Long-Term Stability
The methodology’s robustness was assessed by evaluating all samples multiple times over 23 days. Figure 5 depicts representative data, with recovery values adjusted from the initial analysis, except for the reference material, normalized from certified values.
The wastewater reference material was used, except for Li obtained from the drinking water reference sample. The green region indicates that all measured values fall within a ± 20 % range of the first value.
The PlasmaQuant 9100 Elite’s high-frequency generator produces a highly robust plasma, ensuring consistent and steady signal intensity even in samples with high salt, residual organic, and particle contents.
Table 5. Results of fresh (sample iii, and v) and produced waters (sample i, ii, iv) analysis in fracking fluids. Source: Analytik Jena US
| Element |
Sample i |
Sample ii |
Sample iii |
Sample iv |
Sample v |
Measured
value
[mg/L] |
RSD (n=3)
[%] |
Measured
value
[mg/L] |
RSD (n=3)
[%] |
Measured
value
[mg/L] |
RSD (n=3)
[%] |
Measured
value
[mg/L] |
RSD (n=3)
[%] |
Measured
value
[mg/L] |
RSD(n=3)
[%] |
| B |
63.03 |
0.62 |
236.0 |
1.10 |
0.3291 |
0.87 |
45.49 |
0.44 |
0.8784 |
0.06 |
| Ba |
10.63 |
0.36 |
12.94 |
0.45 |
0.0169 |
0.91 |
3.344 |
1.03 |
0.1021 |
1.78 |
| Ca |
31,030 |
0.46 |
18,150 |
0.46 |
283.3 |
0.58 |
4303 |
0.37 |
288.5 |
0.75 |
| Fe |
97.22 |
0.82 |
359.1 |
0.83 |
<LOD |
- |
0.3625 |
1.05 |
0.1864 |
2.21 |
| K |
956.3 |
0.62 |
7,190 |
1.73 |
17.37 |
0.74 |
1,036 |
0.04 |
33.10 |
0.12 |
| Li |
24.48 |
0.41 |
72.72 |
0.29 |
0.0986 |
1.42 |
27.94 |
1.63 |
1.08 |
0.44 |
| Mg |
3,227 |
1.25 |
1,384 |
0.27 |
83.60 |
1.29 |
641.3 |
2.26 |
145.3 |
0.73 |
| Mn |
5.817 |
0.09 |
10.47 |
0.15 |
<LOD |
- |
0.3965 |
0.38 |
0.0097 |
0.47 |
| Na |
69,870 |
0.67 |
75,680 |
0.60 |
284.6 |
0.41 |
54,870 |
1.13 |
1741 |
0.79 |
| P |
<LOD |
- |
<LOD |
- |
<LOD |
- |
<LOD |
- |
<LOD |
- |
| Sr |
2,271 |
0.62 |
1701 |
0.50 |
6.340 |
0.81 |
1,216 |
2.38 |
5.49 |
0.38 |
| Zn |
8.832 |
0.45 |
8.541 |
0.51 |
<LOD |
- |
0.0670 |
2.28 |
0.32 |
1.08 |
<LOD is less than limit of detection
RSD(n=3) is relative standard deviation of 3 measurement replicates
Analyte Recovery
A spike recovery test was used to determine the accuracy and validity of the sample test results. Table 6 shows all fracking fluid samples' low and high spike recoveries. The high sodium recoveries for fracking fluid samples ii and iv (122 % and 127 %, respectively) could have been attributed to the significant contamination.
Other than sodium, all elements spiked with low and high concentrations resulted in recoveries within ± 20 % of unspiked values, indicating outstanding analytical performance.
Figure 6 depicts the analysis of a generated water sample at various dilution levels. Panel A shows the exceptional plasma stability attained by the high-frequency generator during direct analysis.
The undiluted generated water sample exhibited the greatest variance among the results, which could be attributed to the sample’s high particle pollution.
Further process optimization, such as improving sample homogeneity via digestion with Analytik Jena’s Speedwave microwave or filtration, will likely improve analysis results. Nonetheless, the PlasmaQuant 9100 Elite shows potential for directly investigating fracturing fluids.9,10
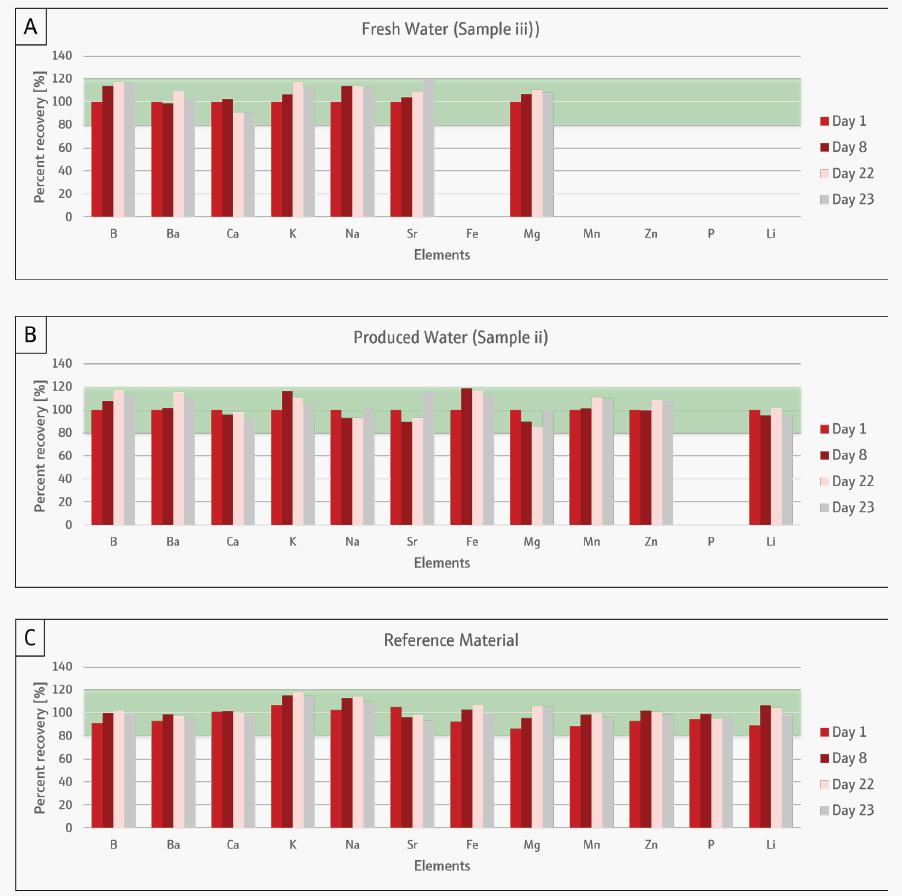
Figure 5. Long-term stability test of (A) fresh water, (B) produced water, and (C) reference material. Results of fracking waters were normalized from the first analysis while results of reference material were normalized from certified values. Elements that show zero recovery values are below LOD. Image Credit: Analytik Jena US
Table 6. Low and high spike recoveries of fresh (sample iii, and v) and produced waters (sample i, ii, iv) in fracking fluids. Source: Analytik Jena US
| Element |
Spike
[mg/L] |
Sample
i [%] |
Sample
ii [%] |
Sample
iii [%] |
Sample
iv [%] |
Sample
v [%] |
| B |
1 |
111 |
82 |
100 |
97 |
104 |
| 10 |
96 |
110 |
103 |
109 |
94 |
| Ba |
1 |
99 |
82 |
100 |
96 |
105 |
| 10 |
91 |
102 |
102 |
104 |
92 |
| Ca |
100 |
116 |
116 |
103 |
111 |
96 |
| 500 |
84 |
90 |
101 |
102 |
97 |
| Fe |
1 |
104 |
84 |
95 |
88 |
110 |
| 10 |
89 |
104 |
99 |
103 |
94 |
| K |
100 |
99 |
112 |
98 |
100 |
93 |
| 500 |
116 |
126 |
112 |
115 |
110 |
| Li |
1 |
102 |
73 |
109 |
93 |
98 |
| 10 |
92 |
106 |
104 |
104 |
92 |
| Mg |
10 |
99 |
97 |
91 |
101 |
87 |
| 500 |
81 |
81 |
89 |
91 |
88 |
| Mn |
1 |
97 |
84 |
102 |
95 |
110 |
| 10 |
91 |
101 |
102 |
101 |
91 |
| Na |
100 |
106 |
174 |
109 |
170 |
110 |
| 500 |
99 |
127 |
118 |
124 |
120 |
| P |
1 |
106 |
90 |
96 |
96 |
109 |
| 10 |
97 |
111 |
101 |
115 |
94 |
| Sr |
10 |
119 |
110 |
120 |
117 |
107 |
| 50 |
81 |
81 |
91 |
89 |
88 |
| Zn |
1 |
98 |
89 |
101 |
100 |
99 |
| 10 |
91 |
105 |
102 |
106 |
92 |
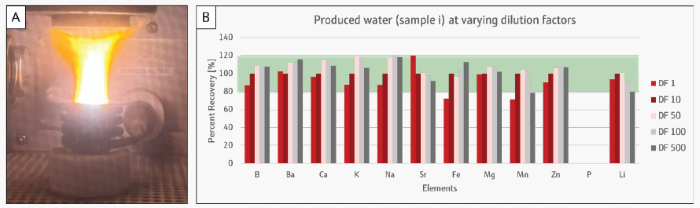
Figure 6. (A) Plasma at direct analysis of produced water sample i. (B) Precent recoveries of fracking fluid sample A at varying dilution factors normalized from dilution factor 10. Measured values for phosphorous were below LOD. Image Credit: Analytik Jena US
Table 7. Overview of devices, accessories, and consumables. Source: Analytik Jena US
| Article |
Article number |
Description |
| PlasmaQuant 9100 Elite |
818-09101-2 |
High Resolution ICP-OES |
| SALT KIT Introduction System |
810-88090-0 |
Concentric nebulizer SeaSpray™ cyclonic spray chamber with dip tube 2.0 mm inner diameter injector tube |
| Teledyne Cetac ASX 560 |
810-88015-0 |
Autosampler with integrated rinse function |
Conclusion
This study demonstrated the PlasmaQuant 9100 Elite ICP-OES’ exceptional ability to accurately and precisely analyze fresh and generated waters in fracking fluids, as seen by an RSD of observed values of less than 3 %.
The high-frequency generator and dual view plus characteristics allow for the reliable assessment of trace to substantial concentration levels of elements.
The PlasmaQuant 9100 Elite ICP-OES has good analytical performance for samples with high salt and organic/particulate content, including fracking fluids. Measured values are within ± 20 % error from CRMs, long-term stability, and spike recovery testing.
Figure 7. PlasmaQuant 9100 Elite ICP-OES. Image Credit: Analytik Jena US
References
- Ground Water Protection Council (GWPC), Modern Shale Gas Development in the United States: A Primer. April 2009 https://netl.doe.gov/files/oil-gas/Shale_Gas_Primer_2009.pdf
- Ayazi P., et al., Screening Friction Reducer Performance Using Zeta Potential, November 2021, Society of Petroleum Engineers, https://doi.org/10.2118/204303-MS
- Fajfer J., et al., Hydraulic fracturing flowback chemical composition diversity as a factor determining possibilities of its management, September 2021, Environmental Science and Pollution Research (2022) 29:16152–16175, https://doi.org/10.1007/s11356-021-16432-7
- McElreath D., Comparison of Hydraulic Fracturing Fluids Composition with Produced Formation Water following Fracturing - Implications for Fate and Transport, January 2017, https://www.epa.gov/sites/default/files/documents/comparisonofhffluidscompositionwithproducedformationwater.pdf
- SaSp, Analysis of Lithium Carbonate for Lithium-Ion Battery Applications using HR ICP-OES. November 2022, Analytik Jena, https://www.analytik-jena.in/knowledge/whitepapers/analysis-of-lithium-carbonate-lithium-ion-battery-using-hr-icp-oes/
- Zolfonoun E., Determination of 6Li and 7Li abundances by inductively coupled plasma-optical emission spectrometry combined with derivative spectroscopy, multivariate curve resolution and multivariate calibration methods, August 2015, Journal of Analytical Atomic Spectrometry. https://doi.org/10.1039/C5JA00181A
- Cantlay, T., and Stolz J. F., ICP-OES Analysis of Flowback and Produced Water Samples from Marcellus Unconventional Gas Extraction, January 2013
- Chorghe D. et al., Boron removal from hydraulic fracturing wastewater by aluminum and iron coagulation: Mechanisms and limitations, December 2017, Water Research, https://doi.org/10.1016/j.watres.2017.09.057
- SeWu, Determination of Elemental Impurities in Pharmaceuticals by HR-ICP-OES according to ICH Q3D and USP 232 and 233, December 2020, Analytik Jena,https://www.analytik-jena.com/import/assets/12515350_AppNote_ICPOES_0010_en_Pharma_ICHQ3D_USP232233.pdf
- Carpenter K. et al., Comparative Laboratory Study of the Geochemical Reactivity of the Marcellus Shale: Rock–Fluid Interaction of Drilled Core Samples vs. Outcrop Specimens, May 2023, Water, https://doi.org/10.3390/w15101940

This information has been sourced, reviewed, and adapted from materials provided by Analytik Jena US.
For more information on this source, please visit Analytik Jena US.