The highly configurable Quantum Design OptiCool® is suitable for integrating into diverse scientific equipment.
This article explores applying a Lake Shore MeasureReady® M91 FastHall™ measurement system to control temperature and field in an OptiCool and perform Hall, resistivity, and mobility measurements in van der Pauw geometry or Hall measurements in 6-wire geometry.
The combination of the OptiCool’s optical access and the highly sensitive M91 FastHall allows users to perform Carrier-resolved photo-Hall effect measurements.
Required Hardware
The following hardware is required to integrate the M91 controller into the OptiCool (Figure 1):
- OptiCool Standard Sample Wiring (X300) fitted into a sample pod bay
- Lake Shore DB25-M91-Triax feedthrough box (4105-222) - provided with the Standard Resistance M91 FastHall Kit (8105-546)
- A 16-pin Fischer to DB-25 sample cable (3318-404-01)
It is also advisable to use a Wired Sample Mount Kit (X150) to ensure easy sample wiring. This is not required, but the Mount Kit includes a gold-plated copper plane thermally connected to the sample pod, along with 16 pre-wired pads for connecting electrical leads to the sample.
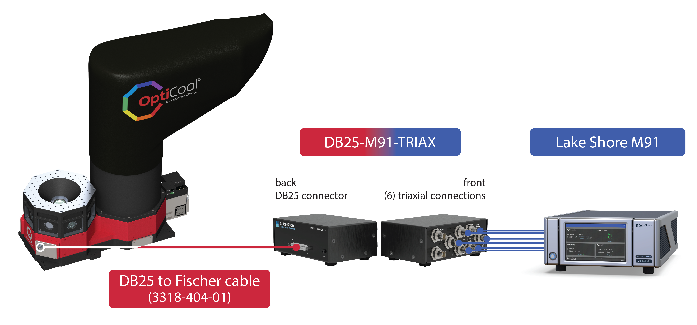
Figure 1. OptiCool connection to the M91 via the feedthrough box and Fischer-DB25 sample cable. Image Credit: Quantum Design, Inc.
Software
The OptiCool MultiVu software allows LakeShore's MeasureLINK® software to connect directly to the OptiCool to control the temperature and field. The MeasureLINK configuration panel can be used to set the QD Application package to communicate with the OptiCool. This should be done using the Instrument drop-down menu under Communication (Figure 2).
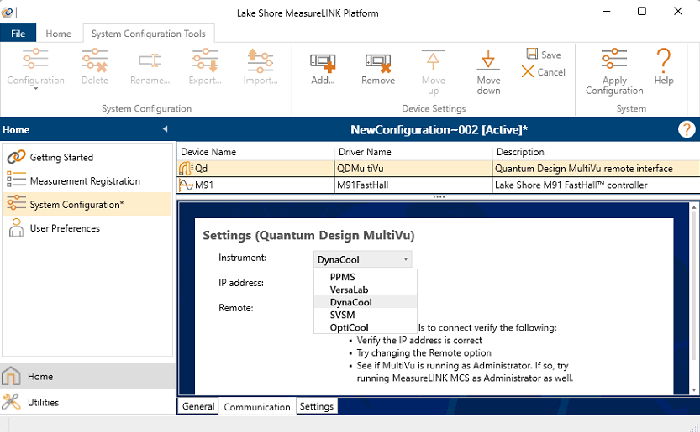
Figure 2. To setup MeasureLINK to use with the OptiCool, make sure the QD MultiVu Application package is installed and then under Home > System Configutation > QDMultiVu > Communications, select OptiCool from the Instrument dropdown. Image Credit: Quantum Design, Inc.
Sample Mounting and Wiring
The M91 instrument supports both van der Pauw (four connections) and Hall bar (six connections) geometries, and samples can be accommodated by wiring to the Quantum Design Wired Sample Mount (Figure 3).
When connected, these sample connections are located on the Fischer connector on the side of the OptiCool. These pins can be connected to the M91 via the DB25-M91-Triax feedthrough box, though it is important to reroute the Triax from the DB25-M91-Triax box to the M91 Fasthall when using the Wired Sample Mount, to avoid wire crossing at the sample itself. The rerouting process involves switching the connections of any wires that would cross.
It is also essential to ensure that the correct M91 port number is connected to the appropriate attachment point on the sample. Due to the specific pad layout on the Wired Sample Mount, however, these numbers will be different on the DB25-M91-Triax box.
When working with van der Pauw geometry, users must swap connections so that port 2 on the M91 connects to port 3 on the DB25-M91-Triax, and vice versa.
When working with Hall bar geometry, users must swap ports 5 and 1, as well as swapping ports 2 and 3 (as in van der Pauw geometry).
Table 1 summarizes connections from the Fisher port to the DB25-M91-Triax box to the M91 for either van der Pauw geometry or Hall bar geometry. It is important to note that the kit includes six triaxial cables, but guarding is only up to the feedthrough box.
Table 1. Pinouts for connections from the Fischer port (Wired Sample Mount), to the DB25 -M91-Triax box, and to the M91 FastHall for either van der Pauw or Hall bar geometry. Source: Quantum Design
| Fischer (Wired Sample Mount) Pins |
DB25-M91-Triax |
M91 port vdP Geometry |
M91 port Hall Bar Geometry |
| 1 (CH A, I+) |
Triax 1 |
1 |
5 |
| 5 (CH B, I+) |
Triax 2 |
3 |
3 |
| 6 (CH B, I-) |
Triax 3 |
2 |
2 |
| 10 (CH C, I-) |
Triax 4 |
4 |
4 |
| 2 (CH A, I-) |
Triax 5 |
n/a |
1 |
| 9 (CH C, I+) |
Triax 6 |
n/a |
6 |
| 8 (CH B, V-) |
AUX 1 |
---- |
---- |
| 7 (CH B, V+) |
AUX 2 |
---- |
---- |
| 4 (CH A, V-) |
Measure Common |
---- |
---- |
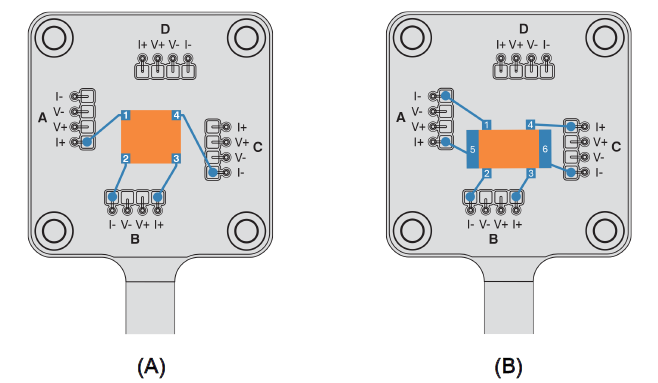
Figure 3. Wiring configurations for van der Pauw (A) and Hall bar (B) geometries on the Wired Sample Mount. Image Credit: Quantum Design, Inc.
Figure 4 features an InAs sample (100), undoped 5 x 5 x 0.45 mm, 2 sp from MTI Corp. This sample was mounted to the Wired Sample Mount.
In the example presented here, a piece of cigarette paper was soaked in thinned GE-7031 varnish before being placed on the Wired Sample Mount to provide an electrically insulating yet relatively thermally conductive layer between the sample and the sample mount.
Next, the sample was attached using GE-7031 varnish. The sample itself was connected using gold wires. These were soldered to the sample via indium bonds to connect the sample to the appropriate pads (Figure 3).
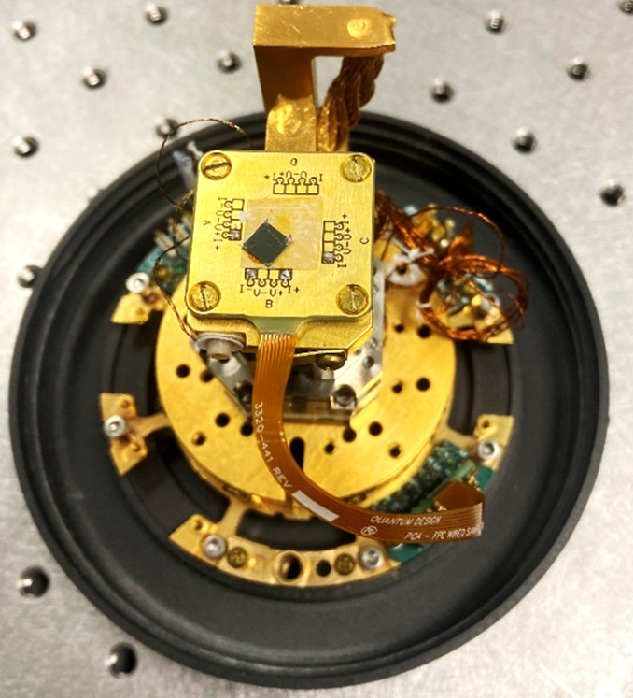
Figure 4. InAs sample mounted to Wired Sample Mount with insulating cigarette paper between the sample and sample mount. Image Credit: Quantum Design, Inc.
Example Measurements
Figure 5 displays acquired resistivity, Hall coefficient, and mobility measurements performed on the InAs sample from 2 k to 300 k. Room temperature mobility is in agreement with values presented in literature, though mobility is reduced by increased impurity concentration and microscopic inhomogeneity – two factors that can be difficult to control.1
As the temperature decreases, the behavior observed represents the contributions of different carriers with different mobilities. This is because the interaction between impurity states effectively forms an impurity band.2
At high temperatures, the impurity band makes no noteworthy contribution. Because the charge density of the conduction band decreases with temperature, however, contributions of the impurity band become more important at low temperatures.2
These impurities influence resistivity behavior and Hall coefficient at low temperatures.
The study presented here shows measurements performed in an optical cryostat, so it is important to carefully consider the impact of optical excitation on any acquired measurements. This setting can complicate the interpretation of acquired data by exciting the charge carried by the sample, which is sometimes referred to as a photocurrent.
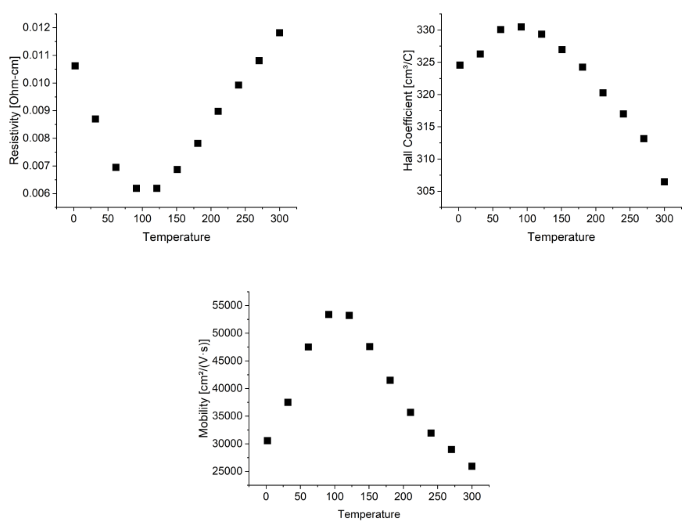
Figure 5. Resistivity, Hall coefficient, and mobility measurements of InAs from 2 K to 300 K measured in an OptiCool with the M91 FastHall measurement system. Image Credit: Quantum Design, Inc.
Carrier-Resolved Photo-Hall Effect
Users must know the photocurrent generated when performing Hall measurements under photoexcitation. The work of Gunawan et al. showcases a method for using photoexcitation to distinguish majority and minority carriers in a sample.3
Examining the slope of the conductivity versus the Hall coefficient – both of which are altered by varying laser excitation intensity – it is possible to determine the densities of both holes and electrons in a sample.
References and Further Reading
- Harman, T.C., Goering, H.L. and Beer, A.C. (1956). Electrical Properties ofn-Type InAs. Physical Review, 104(6), pp.1562–1564. https://doi.org/10.1103/physrev.104.1562.
- Hung, C.S. (1950). Theory of Resistivity and Hall Effect at Very Low Temperatures. Physical Review, 79(4), pp.727–728. https://doi.org/10.1103/physrev.79.727.
- Gunawan, O., et al. (2019). Carrier-resolved photo-Hall effect. Nature, 575(7781), pp.151–155. https://doi.org/10.1038/s41586-019-1632-2.
Acknowledgments
Produced from materials originally authored by Quantum Design.

This information has been sourced, reviewed and adapted from materials provided by Quantum Design.
For more information on this source, please visit Quantum Design.