The cause of failure in engineering structures is routinely investigated via the detailed study of material fracture surfaces. This remains a key research area in material sciences, with researchers working to develop and evaluate theoretical models of crack growth behavior at the nanoscale.
The scanning electron microscope (SEM) is a powerful tool for studying surface changes and fracture mechanics in tensile stress samples.
The SEM’s robust combination of a large field of view and nanometer resolution makes it ideal for detecting the early stages of crack or fracture formation, as well as investigating sample deformation, breakage analysis, changes in roughness, and other surface defects.
However, the SEM does have some limitations. For example, it cannot accommodate quantitative height information and crack/roughness analysis at sub-nanometer resolution.
AFSEM® combines the strengths of SEM and AFM with tensile stages by offering an AFM scanner capable of being inserted in most commercial SEMs, which then enables the correlative, in-situ analysis of tensile stress samples.
This approach is useful because the tip-scanning instrument does not interfere with using a tensile stage. The tensile stage carrying the sample can also be accessed interactively. Unlike a separate AFM system, this approach enables a stepwise increase of tensile stress with in-between analysis without venting the SEM and removing the sample at each AFM analysis step.
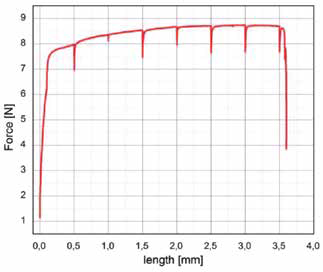
When using a tensile stage, the length of the sample is increased step by step. Tensile force is monitored throughout this process, while the length is kept constant between steps, allowing the sample to relax. A drop in force also accompanies this.
Sample surface analysis is performed with SEM and AFSEM in situ. The SEM provides overview information and supports identifying the region of interest to ensure precise imaging of the same position with the AFM.
Meanwhile, the AFM is utilized to acquire detailed 3D information with nanometer resolution. This enables the accurate determination of any changes in roughness with sub-nanometer accuracy.

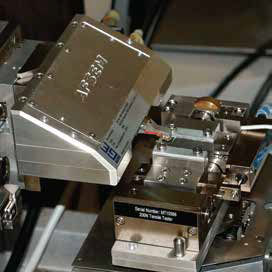
Philips ps XL40 SEM equipped with a Deben MICROTEST 200N tensile stage and AFSEM. Image Credit: Quantum Design, Inc.

Tensile force on a copper wire as a function of the length during 500 µm stepwise increments. Image Credit: Quantum Design, Inc.
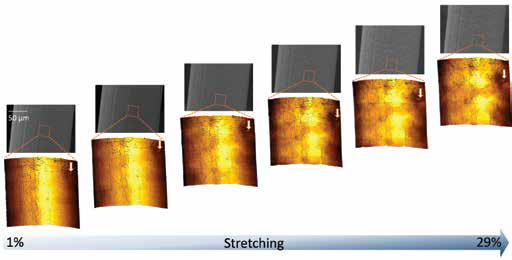
The sample inherently shifts during stretching, meaning that the SEM is essential in appropriately repositioning the cantilever. In the example presented here, recorded AFM images and extracted roughness parameters were obtained on the same area of interest, as seen from the arrows pointing at the same feature in subsequent images. This data was correlated with recorded data from the tensile stage, such as tensile force or length deformation.

SEM and AFM analysis at progressive levels of stretching. Image Credit: Quantum Design, Inc.
Summary
AFSEM represents an ideal solution for acquiring detailed correlative information on even subtle surface changes. This method can provide detailed quantitative data on crack formation or growth, increases in surface roughness, or any other material deformation impacted by tensile stress.
The SEM enables users to guide the AFM to the regions of interest, for example, allowing them to image areas exhibiting constrictions or with increasing cracks. The AFSEM can even scan on a freestanding wire following a breakage.

AFSEM scan on a free-standing wire after a breakage occurred. Image Credit: Quantum Design, Inc.

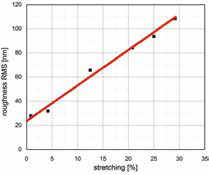
Roughness as a function of stretching during 500 µm step-wise increments. The cylindrical shape was subtracted from the topography before calculating the roughness. Image Credit: Quantum Design, Inc.
Acknowledgments
Produced from materials originally authored by Quantum Design.

This information has been sourced, reviewed and adapted from materials provided by Quantum Design.
For more information on this source, please visit Quantum Design.