Pressure-sensitive adhesives (PSAs) create bonds under low pressure, making them ideal for a variety of applications. Nanomechanical testing of PSAs is critical for understanding their viscoelastic and adhesion capabilities on key structural length scales.
This article examines the viscoelastic and adhesion characteristics of two commercially available PSAs utilizing a Hysitron® TI 990 TriboIndenter® with nanoDMA® IV and an xSol Cryo low-temperature setup.
This cutting-edge system offers exact control over testing parameters, making it a perfect testing solution for industries such as electronics, automotive, aviation, and construction.
Characterization of Adhesives
The growing demand for high-performance adhesives in technically challenging applications, such as cell phones, large-panel displays, and modern construction materials, has driven advancements in adhesive technology at small length scales, ranging from hundreds of nanometers to tens of micrometers.
To support these advancements, effective nano- to microscale characterization methods must address specific force, length, temperature, and strain-rate scales.
Among these methods, nanoindentation stands out as a primary tool for assessing the mechanical properties and tackiness of high-performance adhesives. By quantifying parameters like storage modulus, loss modulus, tan delta, and near-surface work of adhesion under varied conditions, nanoindentation provides valuable insights into adhesive performance.
Adhesives are categorized by their type, chemistry, and structure. This application note focuses on pressure-sensitive adhesives (PSAs), low-modulus elastomers that deform easily under low pressures. This deformation is critical for maximizing the contact area between the PSA and the substrate, as the adhesive interface relies on van der Waals forces for bonding.
Time dependency in PSA properties is characterized by viscoelastic behavior, measured at larger scales using dynamic mechanical analysis (DMA). At the nano- to microscale, Bruker’s nanoDMA technology offers precise measurement of surface properties.
NanoDMA IV with CMX provides displacement feedback control, automated amplitude tuning, force amplitude control, and dual lock-in amplifiers for second-harmonic measurements, allowing detailed characterization of mechanical properties as a function of depth, frequency, and time.
The nanoDMA technique can also be combined with temperature variations for thermomechanical analysis, enabling the measurement of transition temperatures. Short time periods (high frequencies) correlate with low temperatures, and long time periods (low frequencies) correspond to high temperatures, following the Williams-Landel-Ferry model, commonly known as time-temperature superposition (TTS).1
Using TTS, viscoelastic property data can generate a master curve at a specified reference temperature, allowing the TI 990 TriboIndenter to provide frequency-dependent information beyond the capabilities of traditional DMA instruments.
Nanoindentation Procedure
The dynamic and tack properties of two PSAs (Adhesive A, a commercially available re-stickable mini tab, and Adhesive B, an outdoor construction tape) were determined using a Hysitron TI 990 TriboIndenter with Performech® III controller (equipped with nanoDMA IV, xR transducer, xSol Cryo temperature stage, and a standard diamond Berkovich indenter probe).
The xR transducer is Bruker's extended-range transducer, capable of displacements up to 150 µm and force ranges from nN to 10 mN. Reference frequency sweep tests from 9 Hz to 100 Hz were carried out at temperatures ranging from -20 °C to 40 °C.
To achieve consistency in contact depth, a displacement-controlled approach was adopted. Both the dynamic and adhesion tests used large lifts to guarantee that the probe was entirely out of contact before approaching a new surface.
The indenter was put into the sample at 0.5 µm/second and removed at the same speed. Adhesion tests involved a two-second hold segment at the maximum depth before unloading.
It is important to note that various indentation variables will have an influence, as increased contact time, larger area, and higher pressures will result in more Van Der Waals bonds being created.
Adhesive Testing Results
Figure 1 illustrates the strong dependence of storage modulus on both frequency and temperature for the adhesives tested.
Notably, Adhesive B shows greater variation in properties across different temperatures compared to Adhesive A. Additionally, the storage modulus increases as the temperature decreases for all frequencies. This behavior can be attributed to the stiffening of polymer chains at lower temperatures, which restricts their movement.
As the temperature decreases, the flexibility of pressure-sensitive adhesives (PSAs) diminishes, resulting in a harder and stiffer adhesive polymer.
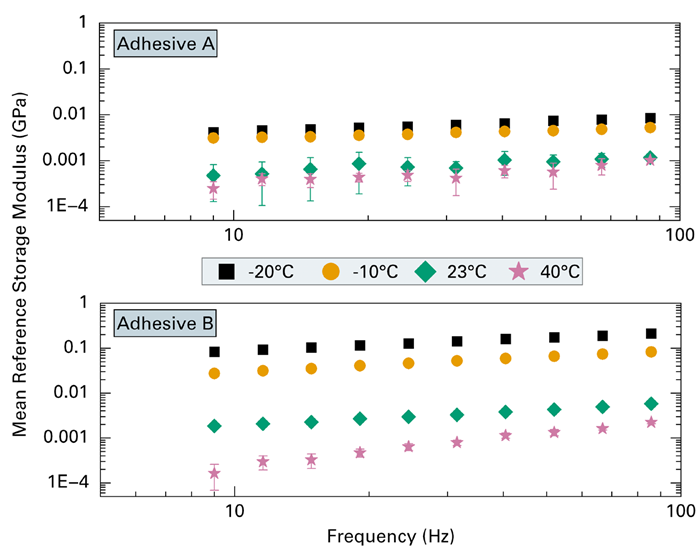
Figure 1. Frequency sweep tests measuring mean reference storage modulus for Adhesives A and B at -20 °C, -10 °C, 23 °C, and 40 °C. Image Credit: Bruker Nano Surfaces and Metrology
Dynamic data from frequency sweep tests was used to generate a master curve (Figure 2, with a reference temperature of -20 °C) using TTS and the Williams-Landel-Ferry equation. This investigation illustrates Adhesive B's frequency dependency from 10-3 Hz to 103 Hz, which spans six orders of magnitude.
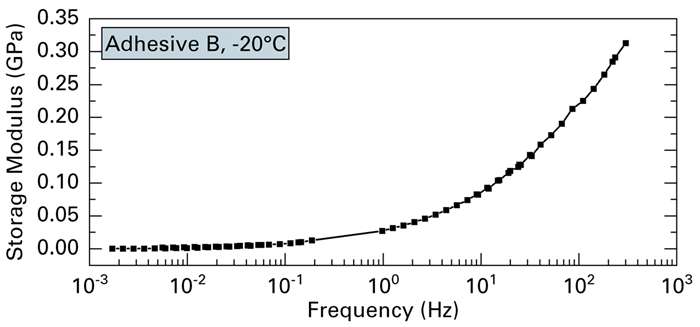
Figure 2. Storage modulus master curve for Adhesive B at -20 °C. Image Credit: Bruker Nano Surfaces and Metrology
Table 1 provides a summary of the results from basic quasi-static indentation tests conducted on Adhesive B. The maximum negative force was determined from the unloading portion of the curve, while the energy required to separate the indenter from the sample was calculated by integrating the force-distance curve where the force is negative—essentially the area under the curve (as illustrated in Figure 3).
Table 1. Maximum negative force and work done to separate the indenter from the sample surface, at different temperatures for Adhesive B. Source: Bruker Nano Surfaces and Metrology
| Temperature (°C) |
Max Negative Force (μN) |
Work (μJ) |
| -20 |
-277.0±13.4 |
378.6±16.5 |
| 23 |
-39.6±1.3 |
232.8±4.7 |
| 40 |
-29.7±2.2 |
152.0±28 |
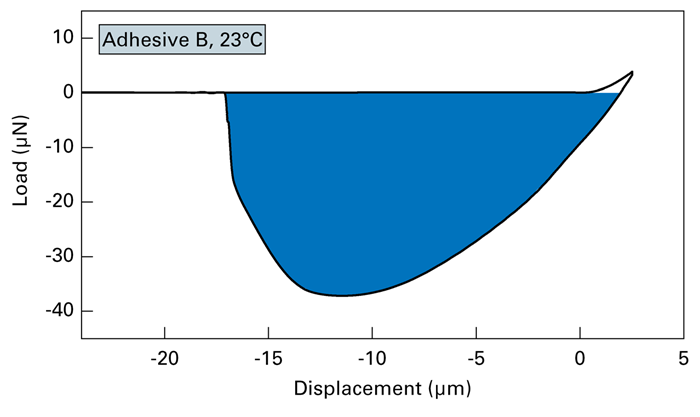
Figure 3. Load versus displacement curve for Adhesive B at 23 °C, showing the maximum negative force required for separation. Area under the curve (shaded) indicates the work done to separate the probe from the sample. Image Credit: Bruker Nano Surfaces and Metrology
As previously stated, as the temperature dropped, the polymer stiffened and became more brittle, resulting in less tack. Figure 4 shows that at -20 °C, the unloading section of the curve abruptly breaks out of contact, but at 23 °C and 40 °C, adhesion persists across a pull-off distance of 10-20 μm.
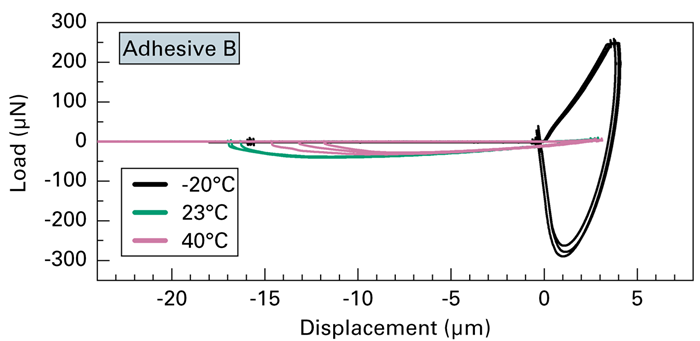
Figure 4. Load versus displacement for Adhesive B at -20 °C, 23 °C, and 40 °C. Image Credit: Bruker Nano Surfaces and Metrology
Superior Control to Evaluate PSAs
Using Bruker’s Hysitron TI 990 equipped with nanoDMA IV and the xSol Cryo setup, the adhesive and viscoelastic properties of two pressure-sensitive adhesives were quantitatively analyzed. This system allowed full control over indenter loading and unloading rates, peak loads, displacements, and other test parameters.
The samples exhibited distinct dynamic and adhesive properties across various temperatures. These testing methods are well-suited for a wide range of soft and/or sticky materials, including biological samples, pharmaceuticals, gels, and polymers.
Nanoindentation-based dynamic and work-of-adhesion tests provide chemists and materials scientists with precise, quantitative measures of material performance.
Acknowledgments
This application note was produced from materials authored by Douglas Stauffer, Sr. Manager of Applications Development, Bruker, and Radhika Laxminarayana, NRL Development Engineer, Bruker.
References
- Williams, M.L., Landel, R.F. and Ferry, J.D. (1955). The Temperature Dependence of Relaxation Mechanisms in Amorphous Polymers and Other Glass-forming Liquids. Journal of the American Chemical Society, 77(14), pp.3701–3707. https://doi.org/10.1021/ja01619a008.

This information has been sourced, reviewed, and adapted from materials provided by Bruker Nano Surfaces and Metrology.
For more information on this source, please visit Bruker Nano Surfaces and Metrology.