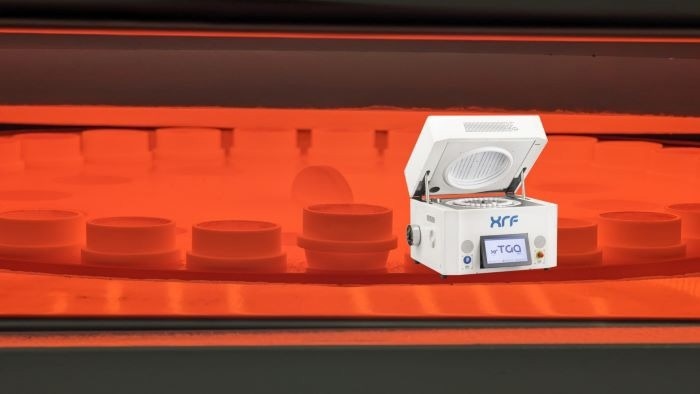
Thermogravimetric analysis (TGA) is fundamental in material characterization, providing insights into material composition and stability under thermal stress.
This approach is vital for engineers and researchers and relies on calculating mass change as a sample endures controlled heating or cooling. Interpreting TGA results involves observing weight fluctuations and understanding a material’s characteristics as it changes with temperature.
The Mechanics of TGA Tools
A sample crucible is the core of a TGA tool. It is contained inside a furnace where thermal transformation happens.
As the temperature increases or decreases, the TGA registers the sample’s mass, providing insight into decomposition, longevity, or stability.
A purge gas manages the environment to prevent contamination from external variables.
Interpreting TGA Curves
A TGA curve displays a material’s thermal properties. Each curve is unique, and the X-axis marks time or temperature, showing the thermal history and stability of polymers and associated materials.
TGA is key in quality assurance and control, as the smallest deviations become clear when batches of the same material are overlaid in a TGA plot.
Tips for Understanding TGA Curves
Understanding TGA curves is a sophisticated procedure that demands a mandatory knowledge of the approach and acute attention to data nuances.
Artifacts in TGA are data distortions derived from external factors. If not accurately recognized and corrected, they can drastically distort results.
One average artifact is the buoyancy effect, where fluctuations in the surrounding gas’ density due to heating can mirror an alteration in sample mass, causing an apparent weight gain between 50–200 µg.
These buoyancy effects must be carefully corrected to ensure data integrity. An automatic blank curve subtraction is often employed, which accounts for these inconsistencies.

Image Credit: XRF Scientific
Selecting the crucible is also crucial in TGA analysis. It must facilitate the gas exchange to and from the sample to ensure the observed mass changes are only because of the sample’s reactions and not restricted gas flow.
An open crucible is typically favored, but a strategically placed hole can slow the process in situations when volatile components might be lost too rapidly, enabling a more controlled analysis.
The temperature program’s rate is equally important. It must be precisely selected to give a thorough thermal profile of the sample while remaining practical for experimental duration.
Rates usually range from 0.5–50 K/min, with 20 K/min being a typical option. The rate should be gradual enough to detect all transitions while still being efficient with time.
The starting temperature, usually between 25–30 °C, is critical for recognizing any moisture content that could be lost and confused with a thermal transition.
The final temperature, which can reach 1000 °C, is chosen from the material under investigation’s thermal stability.
Other thermal analysis approaches are employed when TGA does not deliver enough information. Differential scanning calorimetry can provide data on the heat flow associated with thermal transitions, offering corresponding information on endothermic and exothermic occurrences.
Thermomechanical analysis can calculate dimensional changes inside a material as a function of temperature, which can be linked to events like thermal expansion, softening, or sintering.
TGA in Practice
The TGA test provides valuable data and guides decisions, essential for developing new materials, ensuring manufacturing quality, and meeting environmental regulations.
The approach can be employed across industries, including pharmaceuticals and petrochemical processes, ensuring every material endures heat.
XRF Scientific understands that TGA analysis is crucial in progressing material science. Its XRTGA-1100 has been developed for professionals and integrates perfectly into workflows that demand accuracy and consistency.

This information has been sourced, reviewed and adapted from materials provided by XRF Scientific.
For more information on this source, please visit XRF Scientific.