This article examines how TGA works with a Micro GC, which can be fitted with a mass spectrometer.
Introduction
Operation and Setup of a Micro-GC
A Micro GC's mode of operation and basic setup are fundamentally similar to those of a classical GC.1
The main components of a Micro GC (injector, separating column, and detector) are significantly smaller than those of a conventional GC. As with GC, several separation columns are available for Micro GC depending on the substances to be detected.
Unlike GC columns, the number of chemicals a single column can separate is restricted. A Micro GC often comprises numerous modules with separate columns through which the analyzed gases flow parallel.
Because of the relatively short columns employed, recording a chromatogram takes substantially less time (usually three minutes). Table 1 outlines the key differences between a Micro GC and a GC/MS with a storage interface (IST). Each Micro GC module comes with a thermal conductivity detector (TCD).
A TCD is made of a thermostated metal block with two identical measurement cells, as illustrated in the schematic diagram in Figure 1. The measurement gas being studied passes through one of these cells from the separating column, while the carrier gas (as reference gas) passes through the other.

Figure 1. Functional principle of a TCD detector (for details, see text). Source: http://cdn.analyteguru.com/uploads/2015/11/TCD.png
Table 1. Gas analysis by GC and Micro GC: the most important differences. Source: Mettler-Toledo - Titration
| |
GC/MS |
Micro GC(/MS) |
Typical length of
separating column |
20–60 m;
usually one column |
4–20 m;
usually several columns |
Typical temperature
program of separating
column |
Isothermal: 50 °C, 10–20 min.
Dynamic: 50–300 °C at
5–20 K/min. |
Isothermal: 60–160 °C
(depends on the column). |
Typical analysis time
for a chromatogram |
Isothermal: 15–30 min.
Dynamic: 20–75 min. |
2–3 min. |
Typical analysis
mode coupled
with TGA |
Analysis of the decomposition
gases stored during the TGA
measurement takes place
after the TGA measurement
(offline method) |
Analysis of the decomposition
gases takes place simultaneously
with the TGA measurement
(online method) |
Each cell comprises a filament heated at a greater temperature than the detection block. As a result, heat is transferred from the filament to the detection block, reducing the filament's temperature.
The thermal conductivities of the measurement and carrier gas vary depending on their composition. As a result, the temperatures and, thus, the electrical resistance of the two filaments vary.
The measurement and reference cells are coupled to two extra resistances to form a Wheatstone bridge circuit. This permits measuring the temperature difference between the two filaments in terms of voltage.
Helium has substantially higher thermal conductivity than all other gases except hydrogen, so it is commonly used as a carrier gas.
The thermal conductivities of gaseous compounds at normal temperatures fluctuate insignificantly. This means that a TCD has roughly the same sensitivity to most gases, eliminating the need for lengthy calibration measurements for quantitative determinations.
To a decent approximation, the concentration of a specific gas is the ratio of the gas's peak height (or peak area) to the sum of the peak heights (or peak areas) of all the peaks in the chromatogram.
TCDs also exhibit linear behavior throughout a wide concentration range (a few ppm to 100%). The separating column is an important component that decides which of the gases injected concurrently can be separated from one another.
To separate as many gases as feasible, several separating columns and, hence, Micro GC modules are required.
Table 2 covers the current most popular Micro GC columns and their uses. The yellow-marked columns are the most utilized. They can separate approximately 95% of the gases currently detected using Micro GC columns. Figure 2 depicts a chromatogram from a Molsieve 5 separation column.
This column detects "permanent gases" (H2, CO, CH4, CO2, H2O, N2, and O2). The retention time (the amount of time it takes for a gas to pass through the separating column) is used to identify the gases and varies for each.
Because of the vast number of separable gases, identifying gases based on retention time is problematic when using separating columns that allow bigger molecules to be detected (for example, the CP-Sil 5 CB column). In addition to the TCD detector, an MS detector is recommended for such columns because it is significantly more sensitive.

Figure 2. Example of a TCD chromatogram. Image Credit: Mettler-Toledo - Titration
Table 2. Overview of the most frequently used Micro GC separating columns and the most important gases that can be detected with the various columns. Source: Mettler-Toledo - Titration


Figure 3. Setup of a TGA-Micro GC(/MS) system. Image Credit: Mettler-Toledo - Titration
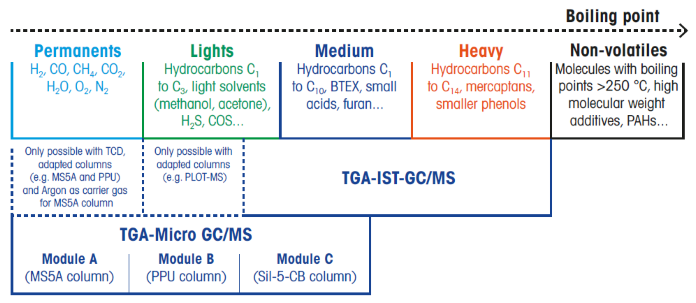
Figure 4. Application range of TGA-Micro GC(/MS) and TGA-IST-GC/MS. Image Credit: Mettler-Toledo - Titration
TGA-Micro GC, TGA-Micro GC/MS
A TGA is connected to a Micro GC or a Micro GC/MS via a transfer line typically heated to around 80 °C, as seen schematically in Figure 3. The gas flow from the TGA is spread evenly throughout the Micro GC modules.
If an MS detector is utilized in addition to the TCD detector, a Micro GC-MS interconnection is necessary. The Micro GC analyzes a gas sample (about 10 μL) in 2-3 minutes.
The results of a TGA-Micro GC (/MS) experiment can then be utilized to generate so-called emission profiles. An emission profile shows how the concentration of a volatile component in the decomposition gas changes with temperature or time.
Together with the TGA curve and its first derivative, it provides a clearer understanding of the processes that occur during mass changes. Figure 4 highlights the applications for TGA-Micro GC(/MS) and TGA-IST-GC/MS.
TGA-Micro GC/MS: An Example
Figure 5 depicts the TGA and DTG curves for a phenol-formaldehyde resin. The measurement was carried out in nitrogen from 100 to 1000 °C at 5 K/min (protective gas 20 mL/min, reactive gas 50 mL/min). The initial sample mass was around 30 mg. A 150 μL aluminum oxide crucible was employed.
The curves demonstrate that the mass loss of around 65% occurred in multiple steps. To determine the products liberated during the various breakdown phases, a TGA-ISTGC/MS analysis was performed.
Eight volatile breakdown products were found (benzene, toluene, m- and p-xylene, phenol, 2-methylphenol, 4-methylphenol, 2,5-dimethylphenol, and 2,6-dimethylphenol). Figure 6 shows the results of 16 gas samples tested using GC/MS at various temperatures.
The curves show the emission profiles for phenols (red curve) and BTX compounds (benzene, toluene, xylene; blue curve), as well as the TGA curve (black).
Phenols are emitted at around 300 °C and BTX compounds between 500 and 650 °C. Small molecules (such as carbon dioxide (CO2) or dihydrogen monoxide/water (H2O)) that would have been expected as decomposition products based on the sample's chemical composition were not discovered. This is because the column utilized did not separate these small molecules from one another; they arrived at the column exit at the same time as the carrier gas (in this experiment, nitrogen (N2)).
The same substance was then analyzed using TGA-Micro GC/MS. The TGA measurement settings matched those utilized for the TGA-GC/MS measurement.
The sample weight was likewise consistent (about 30 milligrams). The Micro GC had three modules that used the following separating columns: Molsieve 5 (argon as a carrier gas to detect hydrogen), CP-PoraPLOT U, and CP-Sil 5 CB. An MS detector was employed in addition to the TCD detector with the CP-Sil 5 CB column.
Figures 7a–7c show the TCD chromatograms produced with the three columns stated above, and Figure 7d shows the TIC chromatogram (total ion current) recorded with the MS detector and the CP-Sil 5 CB column, all measured at a TGA furnace temperature of 620 °C.
The chromatogram produced using the Molsieve 5 column revealed hydrogen, oxygen, and methane (Figure 7a). The chromatogram from the CP-PoraPLOT U column revealed water and CO2 (Figure 7b). Larger molecules (phenol, benzene, and toluene) were detected on the CP-Sil 5 CB column (Figure 7c).
Figure 7d compares the TCD and TIC chromatograms, demonstrating that the MS detector detects xylene and tetrahydrofuran. This reveals that the MS detector is far superior to the TCD detector in terms of sensitivity and detection limit.
Table 3 summarizes the chemicals identified by the Micro GC and the columns used, retention time, and detector specifications. Figure 8 shows how the data from the various chromatograms can be used to construct emission profiles for all the different breakdown products.
The graphic clearly shows that phenols and BTX chemicals are emitted in addition to hydrogen.
The temperature dependence of phenol and BTX emissions corresponds qualitatively to the profiles obtained from GC/MS studies (Figure 6). The remaining components (water, CO2, tetrahydrofuran, oxygen, and methane) are found in trace amounts.

Figure 5. TGA and first derivative (DTG) curves of a phenolformaldehyde resin. Image Credit: Mettler-Toledo - Titration

Figure 6. TGA curve and emission profiles calculated from GC/MS measurements for phenols and BTX compounds (benzene, toluene and xylene). Image Credit: Mettler-Toledo - Titration

Figure 7. TCD and TIC chromatograms of gases measured at a TGA furnace temperature of 620 °C: (a) Molsieve 5 column; (b) CP-PoraPLOT U column; (c) CP-Sil 5 CB column; (d) TIC chromatogram from the MS detector using the CP-Sil 5 CB column. Image Credit: Mettler-Toledo - Titration

Figure 8. TGA curve and emission profiles of all the evolved compounds. Image Credit: Mettler-Toledo - Titration
Table 3. Decomposition products from a phenol-formaldehyde resin sample identified by Micro GC/MS. Source: Mettler-Toledo - Titration
| Name |
Chemical
formula |
Column |
Retention
time (s) |
Detector |
Signal used
for profile |
| Hydrogen |
H2 |
Molsieve 5 |
34.7 |
TCD |
TCD |
| Oxygen |
O2 |
Molsieve 5 |
41.8 |
TCD |
TCD |
| Methane |
CH4 |
Molsieve 5 |
66.3 |
TCD |
TCD |
| Carbon dioxide |
CO2 |
CP-PoraPLOT U |
24.8 |
TCD |
TCD |
| Water |
H2O |
CP-PoraPLOT U |
94.1 |
TCD |
TCD |
| Tetrahydrofuran |
C4H8O |
CP-Sil 5 CB |
31.7 |
MS |
MS (m/z 42) |
| Benzene |
C6H6 |
CP-Sil 5 CB |
32.7 |
TCD and MS |
MS (m/z 78) |
| Toluene |
C7H8 |
CP-Sil 5 CB |
47.9 |
TCD and MS |
MS (m/z 92) |
| m-xylene |
C8H10 |
CP-Sil 5 CB |
76.3 |
MS |
MS (m/z 91) |
| p-xylene |
C8H10 |
CP-Sil 5 CB |
76.3 |
MS |
MS (m/z 91) |
| Phenol |
C6H6O |
CP-Sil 5 CB |
105.4 |
TCD and MS |
MS (m/z 94) |
Summary and Conclusions
TGA measurements offer information about the thermal breakdown of materials under specific air conditions. The breakdown products can be identified using a variety of approaches.1-7
This chapter presented the combination of a TGA and a Micro GC fitted with an MS detector.
The Micro GC(/MS) can detect permanent gases (permanents, e.g., H2, carbon monoxide (CO), methane (CH4), CO2, H2O, oxygen (O2)), low molecular weight compounds (lights, e.g., hydrocarbons C1 to C3, solvents such as methanol or acetone, hydrogen sulfide (H2S), carbonyl sulfide (COS)), and low to medium molecular weight compounds (medium, e.g., hydrocarbons C4 to C6, BTX).
In comparison, TGA-IST-GC/MS can detect molecules with medium to high molecular weights. The two procedures complement one another and can be used with a TGA.
The short analysis time (two to three minutes) required to measure a chromatogram with a Micro GC enables TGA-Micro GC(/MS) measurements to be carried out concurrently. A TGA-Micro GC(/MS) measurement requires significantly less time than a TGA-IST-GC/MS measurement.
At the same time, TGA-Micro GC(/MS) observations yield emission profiles with higher temperature resolution than TGA-IST-GC/MS data.
This article examined the degradation of a phenol-formaldehyde resin. TGA-IST-GC/MS revealed eight volatile breakdown products (benzene, toluene, m and p xylene, phenol, 2-methylphenol, 4-methylphenol, 2,5-dimethylphenol, and 2,6-dimethylphenol).
The emission patterns suggest that phenols appear at about 320 °C, followed by BTX compounds at around 500 °C. In addition to BTX and phenol, TGA-Micro GC/MS revealed the presence of water, CO2, tetrahydrofuran oxygen, and traces of methane and hydrogen.
TGA, in conjunction with a Micro GC(/MS), is indicated for substances expected to produce primarily low-molecular-weight breakdown products (permanents such as H2O, CO2, CO, CH4, etc.). If higher-molecular-weight breakdown products are desired, the combination of a TGA with an IST-GC/MS is the preferred option.
References and Further Reading
- Schubnell, M. Thermal Analysis Application No. UC 451 Application published in METTLER TOLEDO Thermal Analysis UserCom 45. (online) Available at: https://www.mt.com/dam/non-indexed/po/ana/ta-applications/UC451.pdf (Accessed 17 Jan. 2025).
- Hammer, A. Thermal Analysis Application No. UC 461 Application published in METTLER TOLEDO Thermal. Analysis UserCom,(online) 46. Available at: https://www.mt.com/dam/non-indexed/po/ana/ta-applications/UC461.pdf (Accessed 17 Jan. 2025).
- N. Fedelich, Investigation and identification of elements of a rubber compound, UserCom 42, 21–25.
- A. Hammer, Identifying an unknown polymer sample with TGA-GC/MS, UserCom 43, 15-18.
- N. Fedelich, (2022). Evolved Gas Applications Handbook. 2nd edn. METTLER TOLEDO. Available at: https://www.mt.com/us/en/home/library/applications/lab-analytical-instruments/evolved-gas-applications.html.
- Nijman, M. Thermal Analysis Information for Users User Com Thermogravimetry and gas analysis, Part 3: TGA/DSC-FTIR. (online) Available at: https://www.mt.com/dam/non-indexed/po/ana/ta-usercom/30482181_TA_UserCom_47_en_LR.pdf (Accessed 17 Jan. 2025).
- Fedelich, N. Thermal Analysis Information for Users User Com 48 Thermogravimetry and gas analysis, Part 4: TGA-GC/MS. (online) Available at: https://www.mt.com/dam/non-indexed/po/ana/ta-usercom/30526678_V11.18_TA_UserCom_48_EN_LR.pdf (Accessed 17 Jan. 2025).

This information has been sourced, reviewed and adapted from materials provided by Mettler-Toledo - Titration.
For more information on this source, please visit Mettler-Toledo - Titration.