Sponsored by Gatan, Inc.Reviewed by Olivia FrostFeb 26 2025
Shot peening is a mechanical processing surface treatment in which small particles are shot at the surface of a material with a level of force that causes plastic deformation. The deformation creates a compressive stress layer, increasing the treated material's fatigue performance and strength.
From an electron backscatter diffraction (EBSD) characterization perspective, the degree of plastic deformation can challenge characterization in traditional approaches. The amount of plastic deformation can greatly reduce the quality of the EBSD pattern and make band detection using the Hough transform and subsequent indexing difficult.
Spherical indexing is a new approach to indexing EBSD patterns. It is based on a forward modeling approach to comparing experimental EBSD patterns to simulated EBSD patterns to discover the appropriate phase and orientation.
This article characterizes a shot-peened titanium alloy using traditional Hough indexing and spherical indexing. Spherical indexing showed notable improvements, such as the ability to characterize the heavily deformed area on the material surface.
Discussion
For this investigation, shot-peening was completed on a dual-phase titanium alloy. Mr. Prathompoom Newyawond of the NSTDA Characterization and Testing Service Center generously provided this sample.
A cross-section of the treated surface was subsequently prepared for EBSD analysis. The EBSD data was collected using an EDAX Clarity™ direct detector with EDAX APEX™ software. Two separate EBSD scans were collected: a lower magnification scan covering a 34 x 84 µm area with a 100 nm sampling step size and a higher magnification scan covering a 4.6 x 14 µm area with a 30 nm step size.
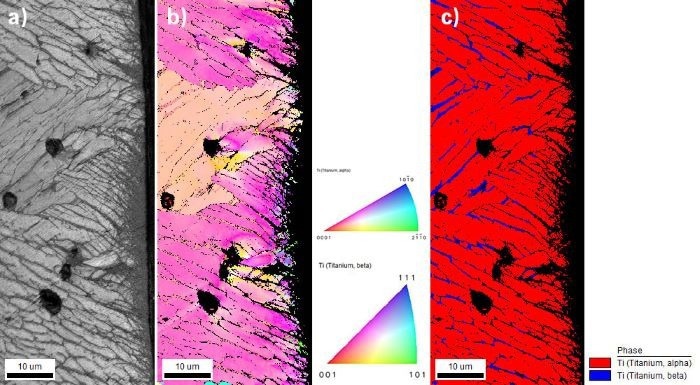
Figure 1. a) An image quality map of lower magnification region of interest. b) An inverse pole figure (IPF) orientation map measured with Hough indexing (HI) colored relative to the normal of the shot-peened surface. c) A phase map measured with HI, with the titanium alpha phase colored red and the titanium beta phase colored blue. Image Credit: Gatan, Inc.
Figure 1 illustrates the results from the scan with lower magnification. Figure 1a shows the EBSD image quality (IQ) map. The shot-peened surface is located to the right of the analyzed area. The image quality metric has been derived from the bands' sharpness and brightness in the EBSD pattern, as discovered by the Hough transform.
Sharper and stronger patterns are more brightly shaded, while weaker and more blurred patterns are shaded more darkly in a continuous greyscale image. At the shot-peened surface, significant image quality reduction is seen, which is caused by the intensive deformation created during processing.
Figure 1b illustrates the inverse pole figure (IPF) orientation map delivered by Hough indexing. In this map, points of lower confidence have been removed from the analysis and are indicated in black.
The orientations are illustrated in relation to the normal of the shot-peened surface (on the image right-hand side) rather than the more usual surface normal of the sample in the scanning electron microscope (SEM). This was chosen to represent the surface orientation as it was subject to the surface treatment. The points are each colored according to orientation in relation to the colored reference stereographic triangle. Figure 1c illustrates the phase map as derived from Hough indexing. Of note is the lamella of beta grains between the primary alpha grains, as well as that indexing performance has greater degradation closer to the shot-peened surface.
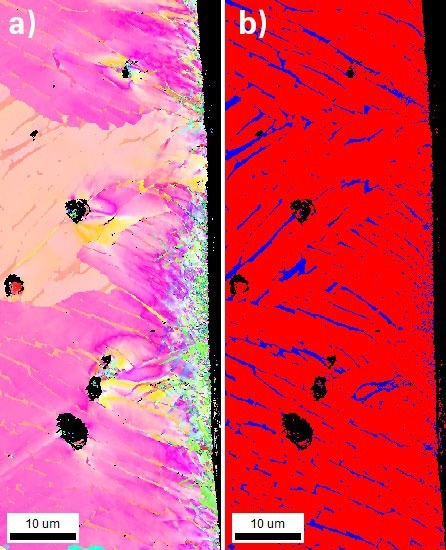
Figure 2. a) An IPF orientation map measured with spherical indexing (SI) colored relative to the normal of the shot-peened surface. b) A phase map measured with SI, with the titanium alpha phase colored red and the titanium beta phase colored blue. Image Credit: Gatan, Inc.
Figure 2a indicates the IPF map of the same region following spherical indexing. In spherical indexing, the patterns are saved while performing the initial acquisition and then reprocessed with the EDAX OIM Matrix™ module within EDAX OIM Analysis™ 9.
Here, spherical indexing was combined with EDAX NPAR™ to improve the EBSD pattern signal-to-noise ratio and the pattern matching that followed. Compared to the Hough indexing in Figure 1b, higher quality data is seen up to the edge of the cross-sectioned sample, and the grain size is significantly finer at the treated surface.
Figure 2c illustrates the phase map following spherical indexing. The beta phase was resolved between the alpha grains throughout the analyzed region. To distinguish between the alpha and beta phases, the experimental pattern was compared to simulated master patterns from both phases, with the best fit chosen for both phase and orientation.
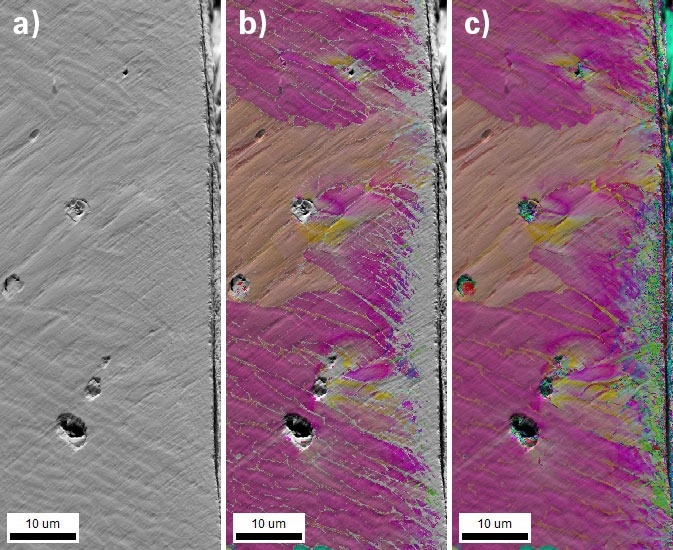
Figure 3. a) A PRIAS map using lower PRIAS ROI. b) A PRIAS map combined with a color IPF map using HI. c) A PRIAS map combined with a color IPF map using SI. Image Credit: Gatan, Inc.
Figure 3a contains an EDAX PRIAS™ image generated by the lower magnification scan, utilizing the lowest region of interest (ROI) PRIAS channel.
This image illustrates the morphology of the sample surface and the edge of the sample surface. To better indicate the differences in indexing performance of the Hough and spherical indexing, the colored IPF maps from both methods have been layered over the PRIAS image in Figures 3b and 3c.
In these maps, the low confidence points are transparent to highlight only the PRIAS signal if the indexing performance is unsatisfactory.
Comparisons of Figures 3b and 3c indicate the spherical indexing improvements up to the edge of the sample and within the beta-lath grains.
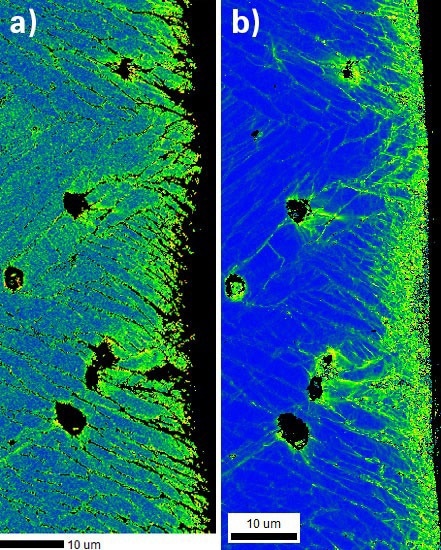
Figure 4. a) A KAM map measured with HI. b) A KAM map measured with SI. Improvement in orientation precision with SI improves contrast between the base metal and the deformed surface layer. Image Credit: Gatan, Inc.
The kernel average misorientation (KAM) map is ideal for characterizing the plastic deformation that develops in shot peening.
Figures 4a and 4b show the KAM maps for the Hough and the spherical indexing, respectively.
Of note is the improvement in orientation precision with spherical indexing, which reduces the amount of noise in the KAM image away from the treated surface and offers increased contrast with the plastic deformation zone at the surface. In Hough indexing, the decrease in pattern quality that results from the deformation reduces the prevision of band detection, which has an increasing effect on the KAM noise level. These results indicate that spherical indexing offers a clearer image of shot peening effects.
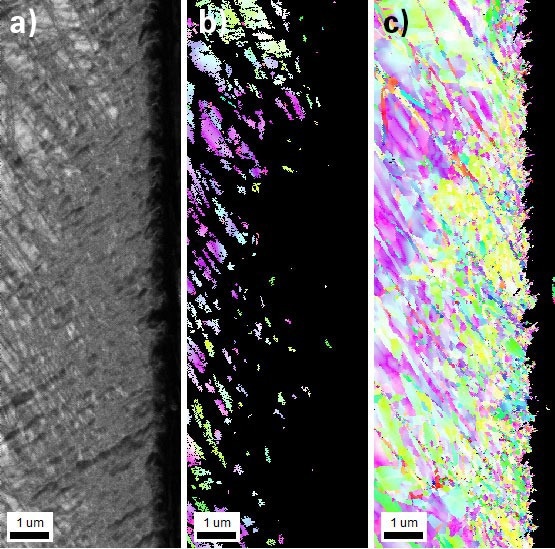
Figure 5. a) An image quality map of the higher magnification region of interest. b) An IPF orientation map measured with HI. c) An IPF orientation map measured with SI. Indexing improvements observed relative to HI. Image Credit: Gatan, Inc.
Figure 5a contains the IQ map with a greater magnification of the shot-peened surface. The IQ map does not indicate a clear structure at the surface, which suggests weak patterns that correspond to increased levels of plastic deformation.
In Figures 5b and 5c, the IPF maps with Hough and spherical indexing, respectively, are shown with the lower confidence points colored black.
Spherical indexing significantly improves this heavily deformed area of interest and reveals a fine-grained region that developed during shot peening. These results demonstrate that spherical indexing is essential to characterizing the microstructure that develops during this processing.
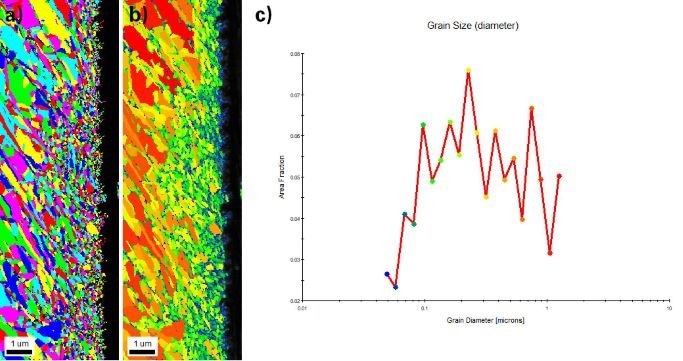
Figure 6. a) A grain map derived from SI. b) A grain size map, colored according to shading used in Figure 6c. c) The grain size distribution with color coding applied to Figure 6b. Image Credit: Gatan, Inc.
Figure 6a contains a unique grain color map derived from the results of spherical indexing. In this map, the grains have been determined using a 5° tolerance angle and then colored at random to show the size and morphology.
The grains are much smaller closer to the surface. Figure 6b contains a grain size map, with Figure 6c indicating a grain size distribution with the same coloring scheme applied in Figure 6b. Grains smaller than 50 nm have been resolved in the deformed region.
Conclusion
This work demonstrates that shot peening creates a significantly plastically deformed region at the surface of the treated material.
Conventional Hough indexing does not have enough sensitivity to satisfactorily analyze the predominantly deformed region, but the microstructure can be analyzed with the new spherical indexing approach implemented in EDAX OIM Analysis 9.
The data obtained can then be used to comprehend and optimize the shot peening parameters to determine the deformation level and depth needed for a given material application.

This information has been sourced, reviewed and adapted from materials provided by Gatan, Inc.
For more information on this source, please visit Gatan, Inc.