Sponsored by Gatan, Inc.Reviewed by Olivia FrostFeb 27 2025
Cipher® maps the lithium distribution in a scanning electron microscope (SEM). Using a combination of quantified backscatter electron (qBSE) imaging and energy dispersive X-ray spectroscopy (EDS), the Li content in a metal-oxide cathode material is estimated. The mean Li content was found to be around 23.8 at.%.
Introduction
Lithium- (Li-) based products have risen significantly in market acceptance over various energy storage applications because of their superior capacity and lighter mass. Today, several differing materials and chemistries are employed—or in development— for anodes and cathodes within an electrochemical cell; lithium iron phosphate and lithium nickel manganese cobalt oxides (NMC) are accountable for around two-thirds of the demand worldwide for cathodes in Li-ion batteries.
Controlling and correlating the structural properties and elemental composition of these materials and examining their evolution over the battery's lifetime is beneficial for optimizing and understanding the properties of the cathodes used in battery applications. That being said, few available tools for measuring the inter- or intra-particle lithium content at an appropriate spatial resolution make it difficult to monitor crucial processes that lead to cell degradation.
Usually, NMC materials used in battery cathode construction are agglomerate oxide particles, which, in the uncharged state, have~ 25 at. % Li.
NMCs possess a chemical formula Li(NixMnyCoz)O2. They are often defined by the ratio of nickel to manganese to cobalt, e.g., NMC xyz (where xyz is representative of the ratio of nickel to manganese to cobalt). However, often used microscale elemental analysis methods, such as X-ray energy dispersive spectroscopy (EDS), are unsuitable for Li detection in battery materials due to the probability that a characteristic Li X-ray being generated depends on the Li-ion's bonding state.
A number of researchers have noted that even though specialized EDS detectors can be useful in detecting X-rays from metallic lithium, Li X-rays are not generated when the lithium is bonded to oxygen—this is a sizable barrier when one considers the lithium metal oxides used in cathode materials.
The large amount of research in Li-based energy storage technologies demands reliable techniques for microscale detection and quantification of Lithium content.
Li quantification and detection – in actuality, light elements generally – offer big challenges in microscale detection in the scanning electron microscope (SEM). However, a quantitative estimation of the Li content in a LiAlMg alloy was recently completed through the use of a composition-by-difference (CDM) method that was based on quantitative backscattered electron (qBSE) microscopy and elemental quantification by EDS and then extended to oxides.1,2
This article shows how Cipher can be utilized in mapping the structure and elemental composition—including lithium—of hundreds of NMC 811 particles with a sub-micron spatial resolution by Li-CDM.
Methodology
An NMC 811 powder that is commercially available and has a nominal lithium composition of 7.3 ± 0.3 wt. % (25.0 ± 1.0 at. %) was analyzed with a Cipher system (model 475.125.70) attached to an FE-SEM.
The sample was prepared by embedding in G3 epoxy and subsequent cross-sectioning by broad beam argon milling using a PECS II™ system (model 685.OV). During the milling process, the sample's temperature was kept below -50 °C to prevent lithium migration. The sample was then moved to the SEM in an inert atmosphere that preserved the sample’s native state through the transfer pod of the PECS II and an iLoadlock™ system.
BSE and EDS analysis were completed with the OnPoint™ (BSE) detector and EDAX Octane Elite Super EDS detector of the Cipher system, respectively. The intensity scale of the BSE images collected with the OnPoint detector was calibrated for mean atomic numbers 6 – 53 utilizing five high-purity standards (Figure 2). All of the analysis and data collection were completed using DigitalMicrograph® software.
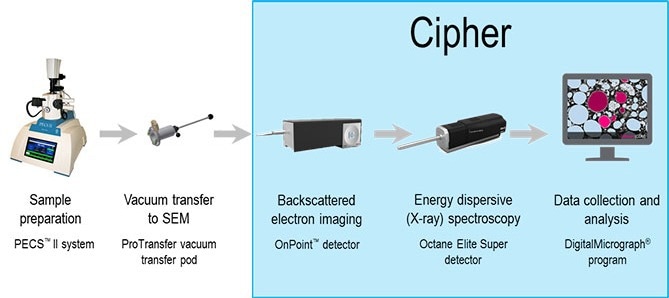
Figure 1. Schematic of Cipher workflow including (from left to right) sample preparation in Gatan PECS II, followed by vacuum transfer to SEM chamber where qBSE and EDS are performed. Once collected, these data are combined and analyzed to produce estimates for Li content. Image Credit: Gatan, Inc.
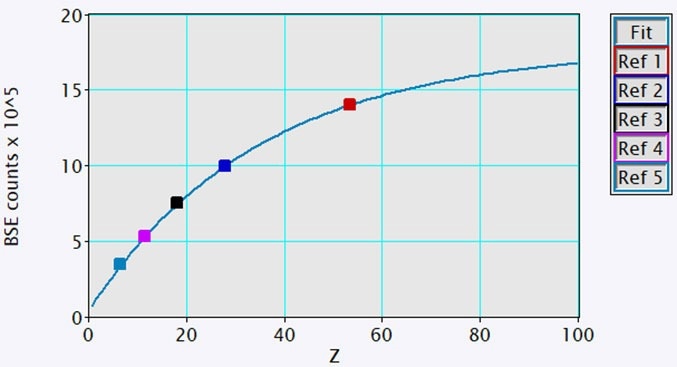
Figure 2. The plot of measured BSE intensity versus mean atomic number for 5 high-purity samples was used as calibration standards (squares). A best fit to the data (line) was determined and used for converting BSE intensity to mean atomic number (line). Image Credit: Gatan, Inc.
Results and Discussion
Through secondary electron (SE) and qBSE images, the NMC particles are in the approximate 5-20 µm diameter range. These secondary particles contained several hundred smaller primary particles, usually 50-<1000 nm in size (Figures 3 and 4).
Comparing the SE and qBSE images revealed that, in some regions (highlighted by red arrows), the qBSE signal included a contribution from topography associated with specimen preparation artifacts and the atomic number contribution used in Li-CDM.
Consequently, areas with a great deal of topography should be removed from Cipher's compositional analysis. That being said, large regions of the sample were appropriate.
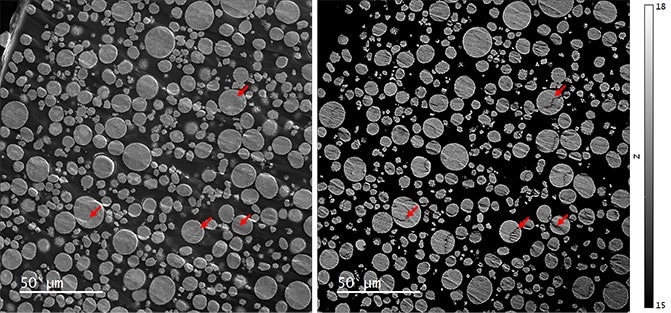
Figure 3. (left) Secondary electron and (right) quantitative backscattered electron (qBSE) images of an NMC 811 powder embedded in epoxy and cross-sectioned by broad beam argon milling. The intensity scale of the qBSE image has been set to display effective atomic numbers 15 – 18. Red arrows indicate some of the regions unsuitable for analysis by Cipher due to the significant contribution of topography to the qBSE signal. Image Credit: Gatan, Inc.
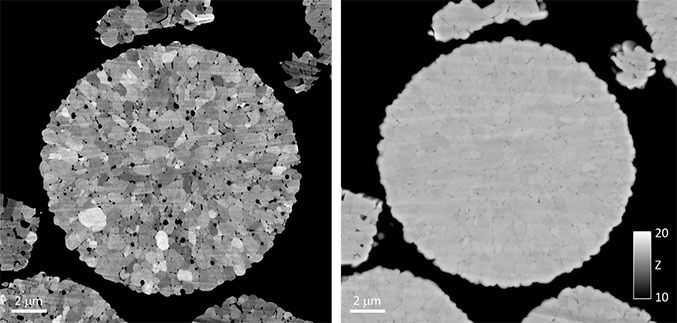
Figure 4. Backscattered electron (BSE) images of an individual NMC secondary particle were collected using the OnPoint detector. A qualitative BSE image captured at a microscope accelerating voltage of 3 kV (a) reveals that each NMC secondary particle consisted of several hundred smaller primary particles of similar size and shape. A quantitative BSE image captured at a microscope accelerating voltage of 10 kV (b) revealed little-to-no variation in the mean atomic number within an individual secondary particle. Image Credit: Gatan, Inc.
An accelerating voltage of 10 kV was selected for the quantitative analysis of the BSE signal. At this condition, the effects of channeling contrast—which, at lower accelerating voltages (Figure 4a), were significant—were found not to be significant (Figure 4b), while a spatial resolution suited to analyzing smaller NMC secondary particles was kept.
The distributions of Ni, Mn, and Co in ~500 particles were discovered by EDS mapping (Figure 5). Quantitative evaluation of the Ni, Mn, and Co content was decided through the standardless eZAF correction method with the background established by physical bremsstrahlung calculation. The mean Ni:Mn:Co ratio was decided to be 8.07:1.0:1.01, which is consistent with the nominal composition of the NMC 811 powder. However, ~5% of particles had an Mn content of ~50% less than the mean.
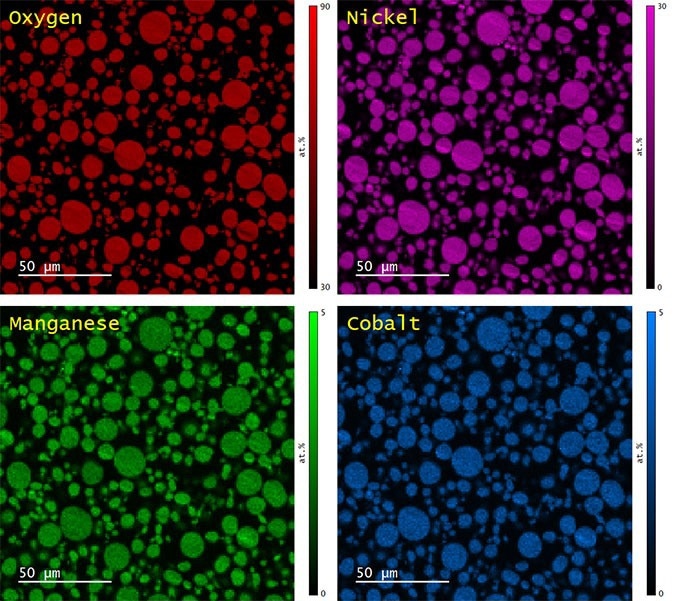
Figure 5. Elemental maps of O (red), Ni (magenta), Mn (green), and Co (blue) as determined by quantitative analysis by EDS. Image Credit: Gatan, Inc.
The qBSE data and elemental maps were utilized in calculating the lithium content using Cipher’s composition-by-difference algorithm (Figure 6). The two data types were registered based on the cross-correlation of the SE images captured in sync with each signal. Corrections for rotation, x-y translation, magnification, and sampling were applied through automation.
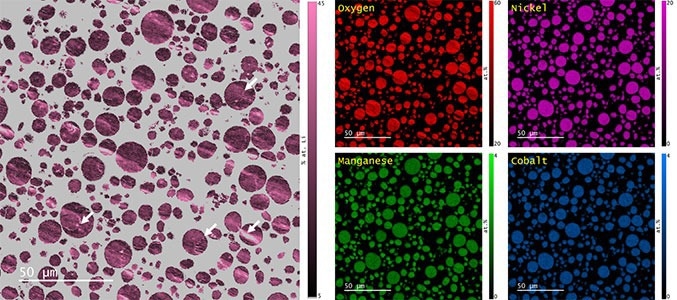
Figure 6. (left) Map of the Li content in NMC 811 particles and (right) re-scaled Ni, Mn, Co, and O elemental maps after accounting for the Li content. Note that the grey color in the lithium map corresponds to regions of the sample that were not suitable for analysis by Cipher due to the significant fraction of H in the epoxy. Image Credit: Gatan, Inc.
The mean lithium content of the NMC powder sample was 23.8 ± 3.9 at. %, which compares quite favorably with the nominal value of 25.0 ± 1.0 at. %. As was anticipated, some areas of the sample with strong topography created anomalously high lithium values and should not be considered (see the red arrows in Figure 6). However, the intraparticle variation was minimal, and a significant difference in lithium content was not seen between particles.
Summary and Conclusions
Cipher was used in estimating the Li content in ~300 NMC 811 particles and determined a mean lithium content of about 23.8 ± 3.9 at. %. This is the first experiment where the lithium content in cathode materials was mapped at this length scale, with exciting results that can pave the way toward the ability to study lithium migration at the microscale throughout the charge-discharge cycle in battery cells. This promises to deliver new insight into compositional and structural evolution over the cell's life span.
References and Further Reading
- Österreicher, J.A., et al. (2021). Spatial lithium quantification by backscattered electron microscopy coupled with energy-dispersive X-ray spectroscopy. Scripta Materialia, 194, pp.113664–113664. https://doi.org/10.1016/j.scriptamat.2020.113664.
- J. Lee et al., Microsc. Microanal. 28 (2022), p548-550

This information has been sourced, reviewed and adapted from materials provided by Gatan, Inc.
For more information on this source, please visit Gatan, Inc.