Sponsored by XradiaApr 22 2013
TBC is an advanced material system demonstrating high chemical stability and low thermal conductivity, which make it to serve as a resistant barrier to protect metal substrates from thermal degradation and oxidation. Due to this reason, it is widely utilized in high-temperature gas turbines, combustion engines and aero-engines. A typical TBC system is composed of three material layers: metal substrate, bond coat, and top coat. Top coat, generally yttria- stabilized zirconia (YSZ), exhibits very low thermal conductivity for insulation, thus minimizing air-cooling requirements and enabling high operating temperatures.
Significance of Microstructural Characterization of TBC
The properties and insulting performance of TBC are greatly influenced by its microstructures, such as coating thickness, porosity, pore morphology, and microcrack formations. The changes in porosity of TBC during thermal cycles greatly affect its thermal conductivity, thus causing difference in strength of top coating. Hence it is essential to gain insight into the correlation between TBC properties and its microstructures in order to harness the coating properties and microstructures.
Limitations of Conventional Techniques
TBC microstructural characterization has been widely performed with scanning electron microscopy and optical microscopy in the past. However, these techniques can only provide 2D information and need destruction of the sample in order to investigate its internal structures. Moreover, artificial cracks and delamination of the top coat are often the results of performing the required physical cross-sectioning.
In recent times, 3D optical coherence tomography and thermal tomography methods have been employed for TBC layer characterization. Although, they are inherently non-destructive, low spatial resolution (a few tens of microns) and poor penetration depth (a few hundreds of microns) are their disadvantages.
Solution from Xradia
To address the limitations of existing imaging techniques in microstructural characterization of TBC, Xradia offers the VersaXRM 3D X-ray microscope (XRM) family with non-destructive submicron true spatial resolution. The VersaXRM-500, a member of the VersaXRM family, is a lab-based 3D XRM providing submicron (<0.7 µm) imaging and 3D characterization of TBC systems. It is non-destructive in nature, and captures high-resolution images of interior structures in comparatively large TBC samples thanks to its unique architecture design.
The results of the imaging of a 1-mm-thick thermal-cycled plasma-sprayed TBC system with a VersaXRM-500 are shown in Figure 1 and 2. Segmentation and quantitative analysis were done utilizing water-shed algorithm and tophat techniques offered by Avizo Fire software.

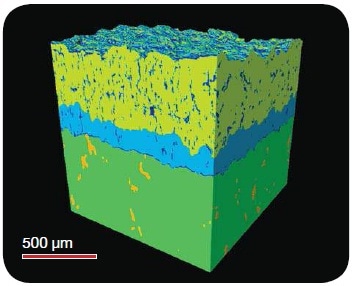
Figure 1. 3D surface color-rendered image of a TBC system. Metal substrate (Ni super-alloy) is labeled in green at the bottom; bond coat in light-blue in the middle and top coat in yellow on the top. The blue in the top coat layer represents internal voids or cracks. The orange in Ni super-alloy substrate represents high-Z material segregation.
From the results, it was observed that metal substrate had 5% high-Z inclusion, a result of material segregation in high-temperature thermal cycles, and the porosity of top coat and bond coat was 7.8% and 1.2%, respectively. Suspected delamination at the interfaces of top coat and bond coat was not found, confirming the good condition of the TBC system even after thermal cycles.

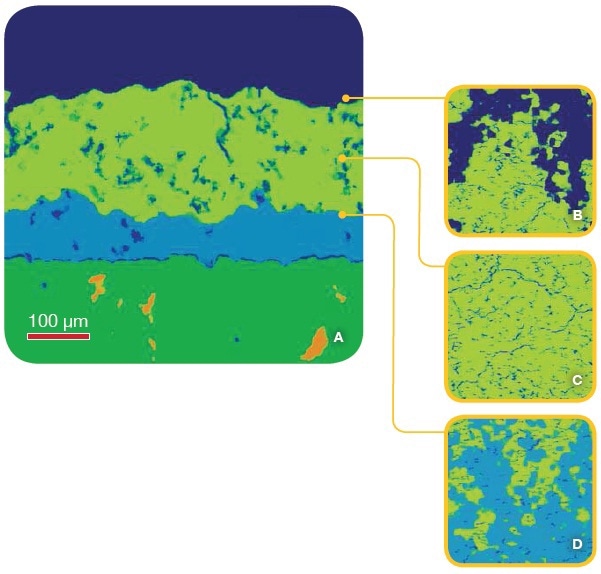
Figure 2. X-ray micrographs of the virtual cross-sections of a plasma-sprayed TBC system. The image (at 2 µm pixel resolution) was acquired using a VersaXRM system and the raw data were segmented and analyzed using Avizo Fire software.
A) cross-section shows the three-layer materials system: Ni super-alloy (green), bond coat (light blue) and top coat (yellow). Blue color represents internal voids or cracks
B) interface of top coat and air (dark blue)
C) a cross-section of the top coat
D) interface of the bond coat and the top coat.
The relative positions of cross-sections (B-D) to (A) are indicated by the markers pointing left.
Virtual cross-sections throughout the 3D TBC image also confirmed that the interfaces of the three TBC layers are not simple sinusoids but an intricate geometry, contradicting the assumption made by the researchers when developing models. Cracks that were hundreds of microns to several microns long were found in the top coat layer (Figure 2C) caused by the thermal difference between the bond coat and top coat. The observed micro-cracking is a key failure mode of TBC systems as it may probably cause topcoat delamination.
Conclusion
The VersaXRM X-ray microscope is capable of providing unique value for the quantitative analysis and 3D characterization of TBC systems, which is often a difficult task with other conventional microscopic techniques. With unique architecture design and non-destructive nature, the VersaXRM-500 provides high- resolution and artifact-free 3D images of TBC systems in order to get volumetric and quantitative data on key characteristics, such as pore morphology and volume percentage, layer interface, microcracks and voids.

This information has been sourced, reviewed and adapted from materials provided by Xradia.
For more information on this source, please visit Xradia.