The global photovoltaic (PV) trade is a key factor in increasing solar power generation and reducing total carbon emissions, helping to drive the world forward into a carbon-neutral future. To consider the effect of trade barriers and analyze global trade patterns in the PV industry, a paper has been published in Nature Communications.

Study: Breaking down barriers on PV trade will facilitate global carbon mitigation. Image Credit: Melinda Nagy/Shutterstock.com
The Role of PVs in Emissions Reductions Targets
The push to net-zero by 2050 will require significant reductions in carbon emissions alongside mitigation strategies, carbon capture technologies, and increasing electrification of key industrial sectors. The IPCC predicts that to achieve the goal of net-zero, between 38% and 88% of primary energy and 59% and 97% of electricity must come from renewable resources by 2040 at the earliest.

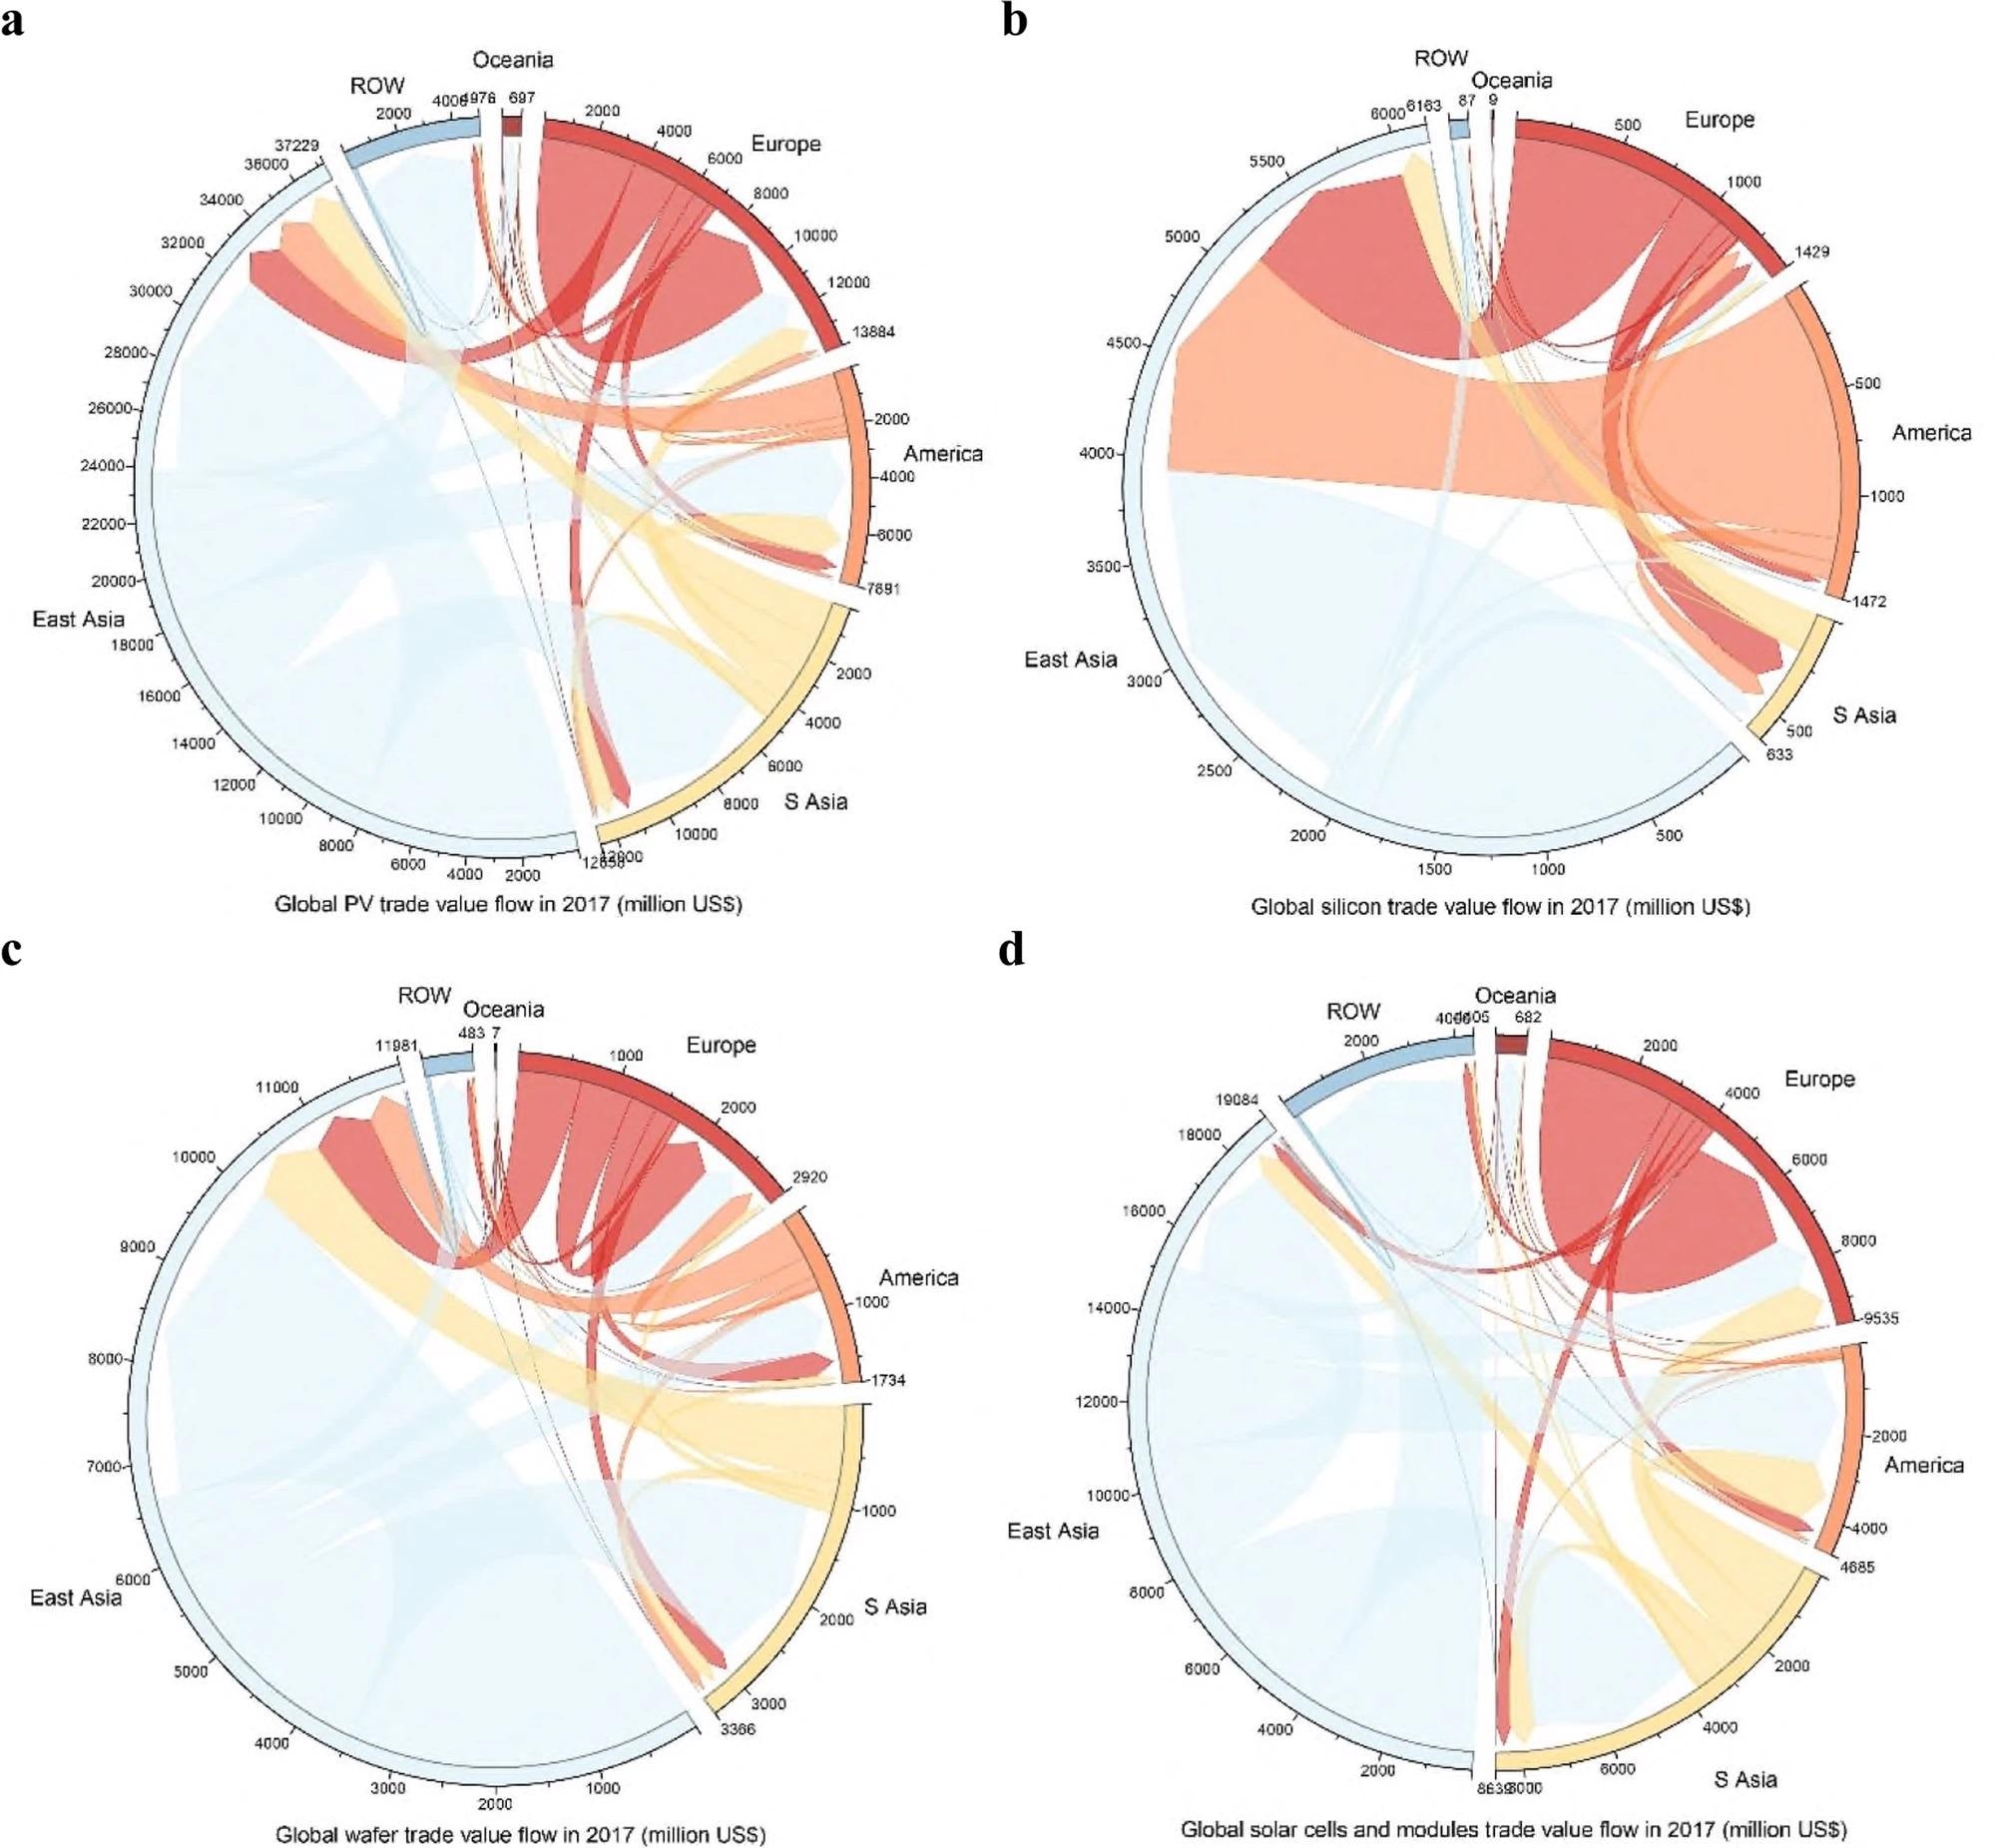
Global solar photovoltaic (PV) product trade flow. Chord graphs present global PV product trade flows in 2017, including total trade value flows and three categories of PV product trade flows. S Asia is the abbreviation for Southeast Asia. ROW is the abbreviation for the rest of the world. Light blue ribbons represent trade flows from East Asia and ROW, and yellow, orange, red, and dark red ones are trade flows from Southeast Asia, America, Europe and Oceania, respectively. a This figure shows global total PV trade flows. East Asia is the largest PV product exporter and importer region, and Southeast Asia is the second-largest importer region. The largest interregional flow is from East Asia to Southeast Asia. b–d Describe global trade value flows of silicon, wafers, and solar cells and modules, respectively. East Asia leads in all PV product trade. Europe and the Americas tend to produce and export silicon to and import solar cells and modules from Asia. Southeast Asia acts as an important exporter of silicon wafers and solar cells and modules and have close trade links with other regions. Image Credit: Wang, M et al, Nature Communications.
Solar power will be a key technology to achieve this reduction and drive the world toward a carbon-neutral future. Recent advances in photovoltaic (PV) technologies have increased the efficiency of solar cells, helping to ramp up their power harvesting and storage capabilities.
Recent Increases in PV Solar Cell Energy Production
Between 2007 and 2017, the global installed power capacity of solar cells increased from 2 gigawatts to 103 gigawatts, and the total cumulative installations increased from 8 gigawatts to 409 gigawatts. Total global power generation in 2017 was 443.55 terawatt-hours, which accounted for 1.72% of total global power generation. This was a significant increase from 2007 levels, which, at 7.48 terawatt-hours accounted for 0.04% of total power generation.
PV Technologies and Emissions
It is widely recognized that solar power will substantially reduce global carbon emissions. However, carbon emissions are still produced in their production and must be considered in the context of the product’s life cycle. Recent studies have attempted to categorize these emissions and develop strategies to reduce them.
Studies have been conducted on improving storage and batteries, materials used in PV solar cells, the end-of-life contribution of device components, comparison studies between solar power and other renewable and non-renewable energy harvesting technologies, and the impact of solar energy on future power generation and electricity grids.

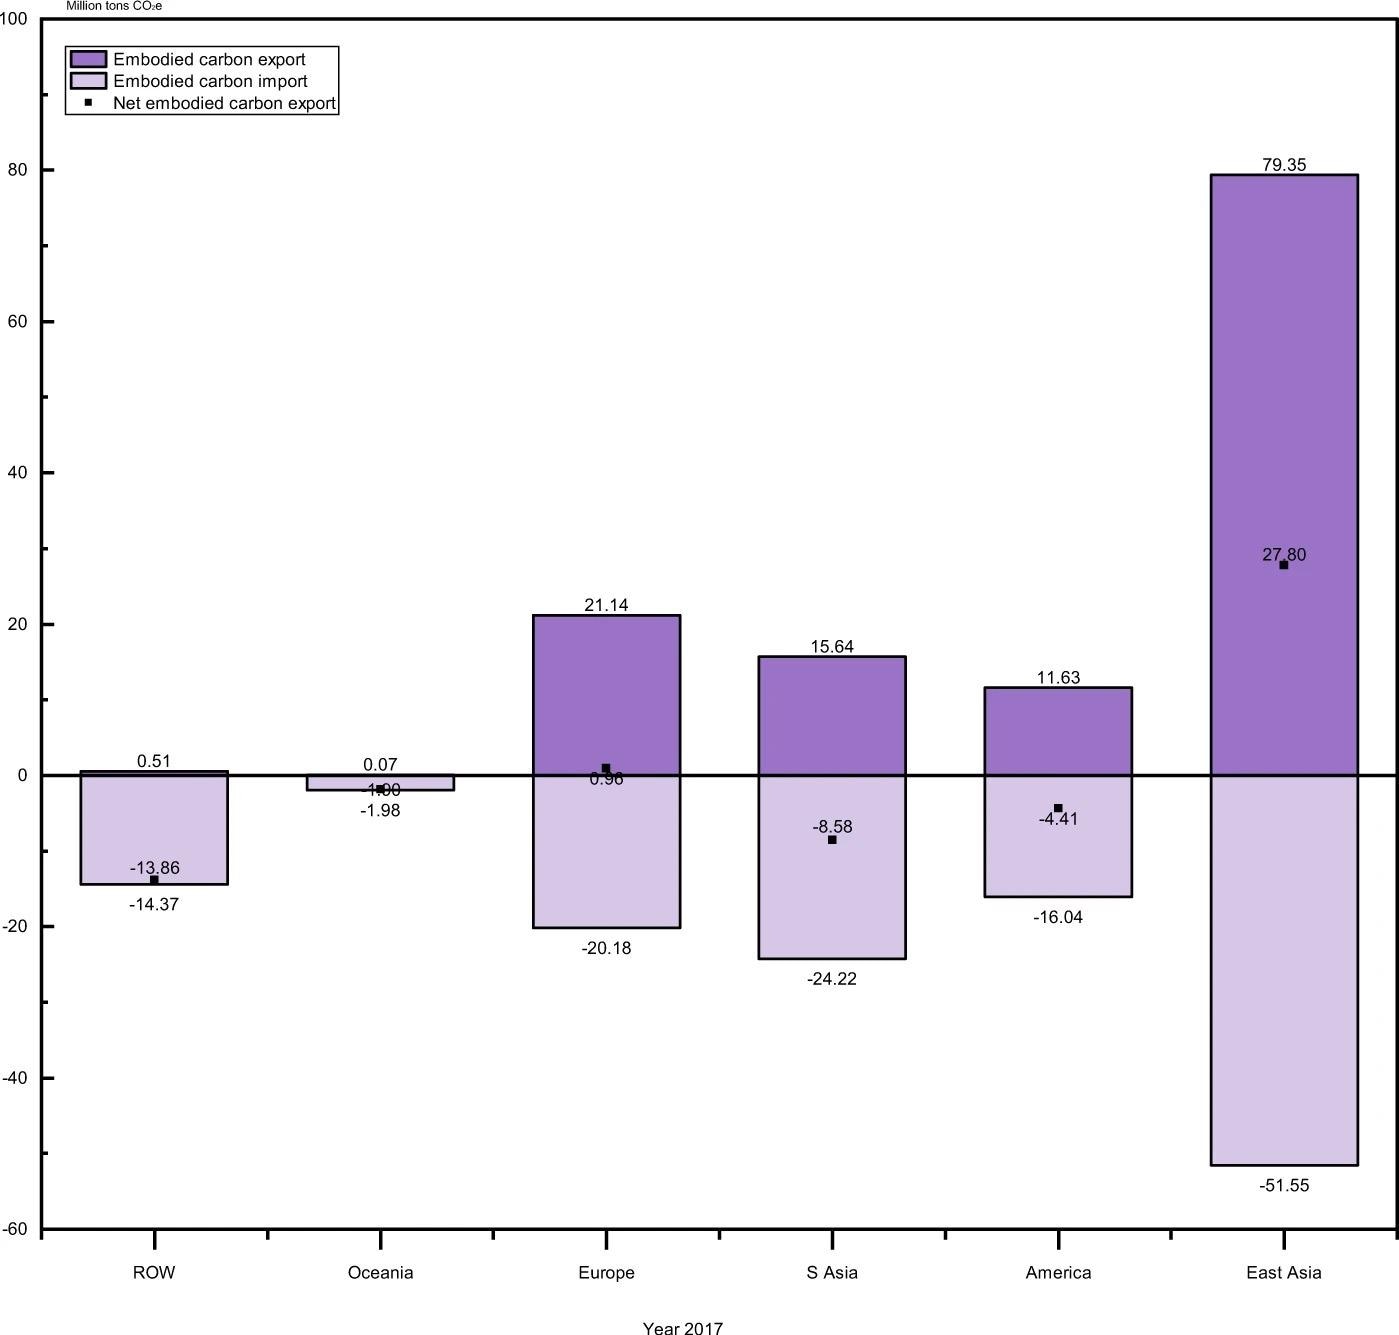
Balance of carbon emission embodied in the solar photovoltaic (PV) product trade in 2017. S Asia is the abbreviation for Southeast Asia. ROW is the abbreviation for the rest of the world. The column chart shows the balance of total carbon emission embodied in the global PV product trade by region: Dark purple bars above the horizontal axis (y = 0) represent carbon emission embodied in exports, and light purple bars under the horizontal axis represent carbon emission embodied in imports. Black dots represent the balance of embodied carbon emission (BEETC). Image Credit: Wang, M et al, Nature Communications.
The Impact of Global PV Trade
Global trade in photovoltaic solar cells has developed rapidly in recent years, substantially contributing to the global production and application of these products. Traded capacities in 2017 reached 79.65 gigawatts, which accounted for 19.47% of global cumulative PV capacity installation. Global trade accounted for 76.8% of global capacity, increasing to 96.19% in 2018. International trade in PV technologies provides less expensive photovoltaic products and reduces costs.
The Impact of International Politics and Trade Barriers
International politics and the impact of trade barriers affect global PV trade, with protectionism emerging. Recent trade barriers have put up roadblocks to international trade, with an example being the US-Chinese trade war.
The “301 Investigation” that the USA initiated against China on imported goods includes solar panels, which has led to increasing trade measures between two of the largest economies in the world. These have spilled over and now affect nations such as Mexico, Canada, and the European Union. Whilst most studies have concentrated on the economic impact of these trade barriers, the environmental impact of global supply and consumption change has not been adequately explored.
Very few studies have investigated the negative impact of global trade wars and barriers on the industry in terms of production and application and how this affects the potential of cutting global emissions in line with international agreements. Trade barriers significantly affect the ability of less-developed nations to increase solar power in their national energy grids, meaning they must still overwhelmingly rely on fossil fuels.

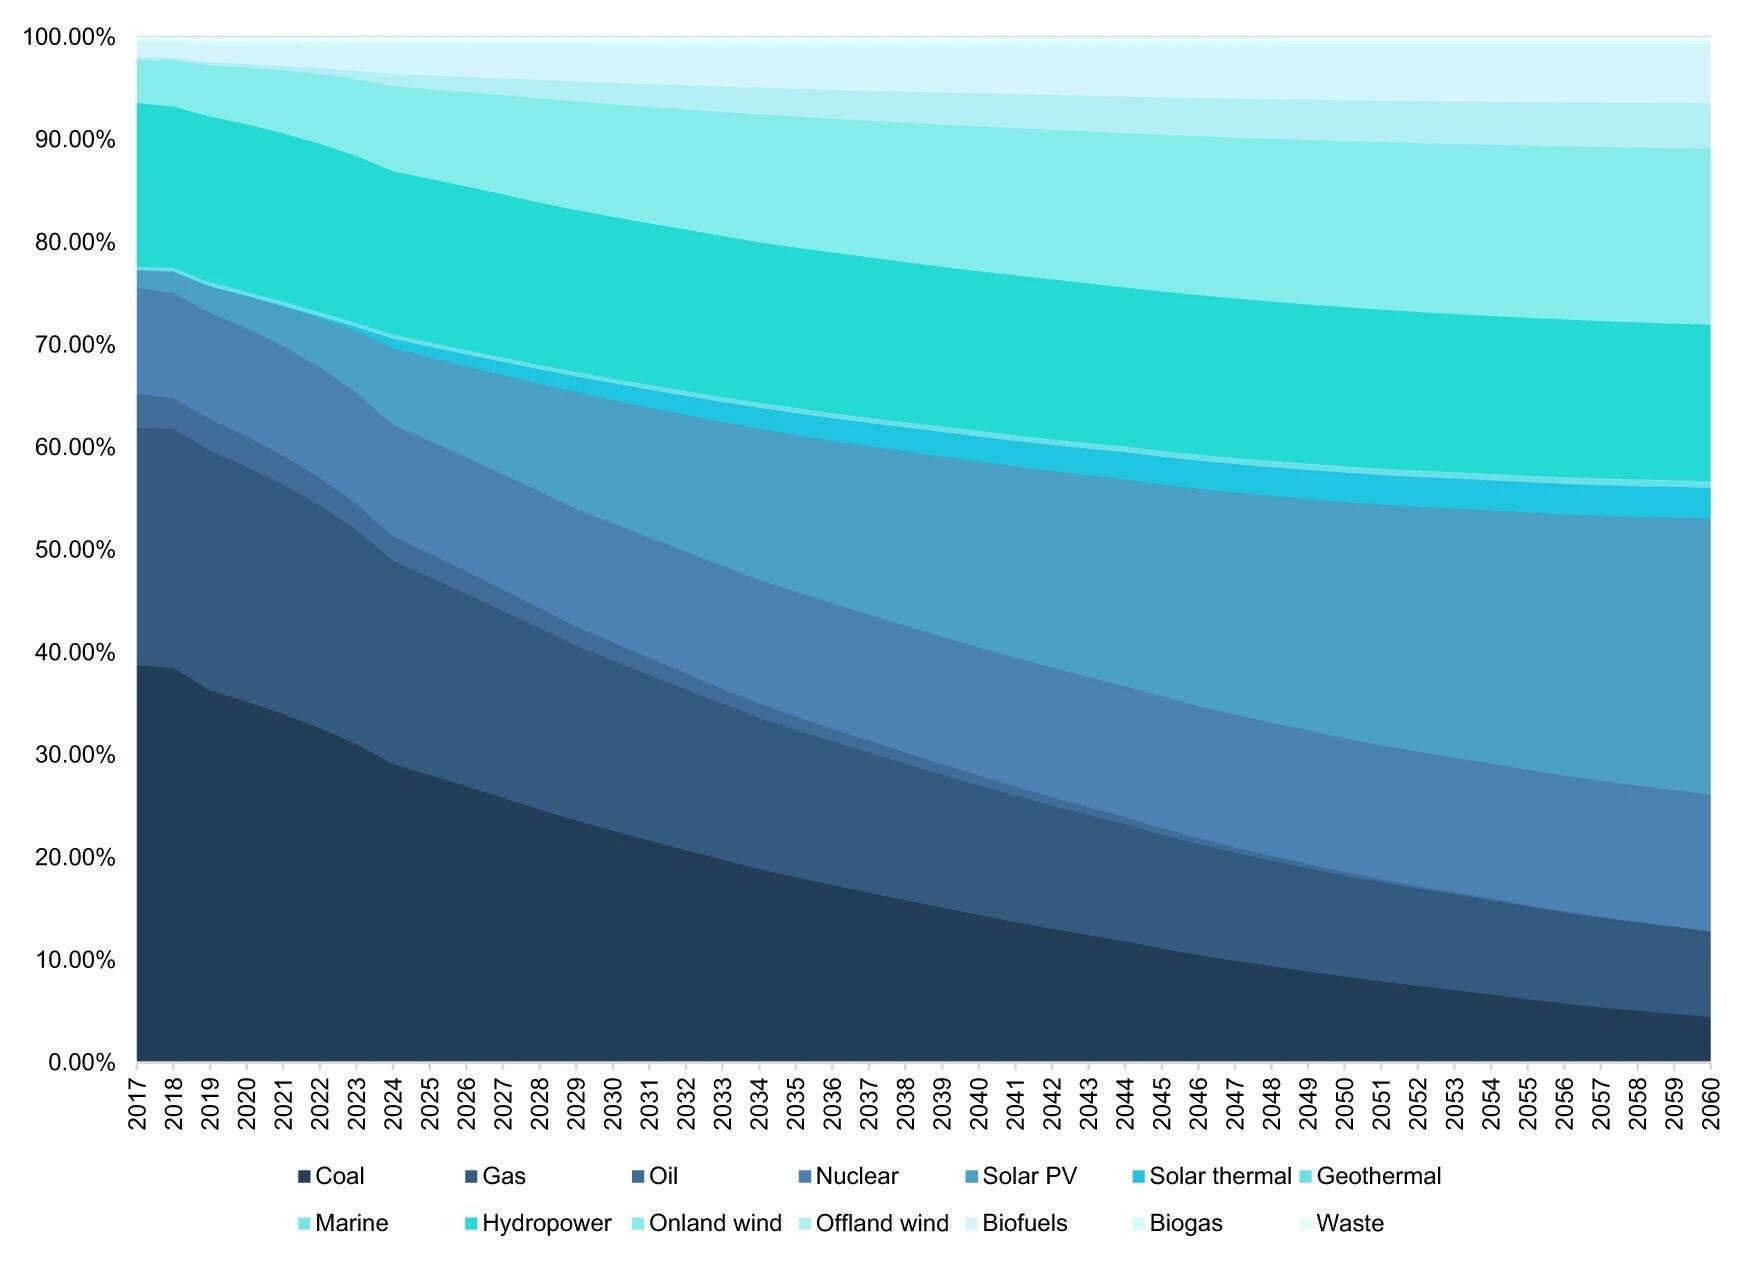
Projection to global electric power production composition from 2017 to 2060. The ribbons in different colour intensity scales represent the share of various power generation technologies. The world total is obtained from the International Renewable Energy Agency (IRENA). The power-generation composition is projected by the integrated modelling system (IMS) model simulations based on country-/economy-specific National Determined Contributions (NDCs) or long-term energy mix target commitments of 24 major solar photovoltaic (PV) applications and trade partner countries/economies. That of the countries/economies other than these 24 countries/economies is obtained by subtracting the subtotal of the 24 countries/economies from the world total. Image Credit: Wang, M et al, Nature Communications
Overcoming International Barriers
The paper published in Nature Communications has presented an analysis of the global PV trade and the impacts of restrictions and trade liberalization measures. The study includes a trade flow matrix, calculations on embodied carbon, provides projections of net carbon emission reduction potentials, and attempts to demonstrate and disclose how current trade barriers could severely impede the potential to reach net-zero by 2050.
The study predicts that global uptake of PV technology will result in a global CO2 reduction of 50-180 gigatons by 2060 in a business-as-usual scenario.
It explains how global protectionism harms the environment by impeding solar power development, and that removing half of existing trade barriers will increase the application of PV technologies by 7.2% and potentially reduce global emissions by 4-12 gigatons of carbon dioxide. Extra barriers are projected to increase global emissions by 3-4 gigatons by 2060.
The paper makes it clear that to realize the potential of PV solar cell technologies and reduce carbon emissions, global trade barriers must be overcome, and global uptake increased significantly in both developed and developing nations.
Further Reading
Wang, M et al. (2021) Breaking down barriers on PV trade will facilitate global carbon mitigation [online] Nature Communications 12 | nature.com. Available at: https://www.nature.com/articles/s41467-021-26547-7
Disclaimer: The views expressed here are those of the author expressed in their private capacity and do not necessarily represent the views of AZoM.com Limited T/A AZoNetwork the owner and operator of this website. This disclaimer forms part of the Terms and conditions of use of this website.