In a recent study published in the journal Carbon, researchers from the Republic of Korea analyzed the correlation between the thickness of the graphene oxide layer and the degree of oxidation with the oxygen-carrying functional groups. They found that the degree of oxidation had a directly proportional relationship with the thickness and d-spacing of the specimens.

Study: A study of the correlation between the oxidation degree and thickness of graphene oxides, Image Credit: Daniel Ramirz-Gonzalez/Shutterstock.com
Delamination of Graphene with Graphene Oxide
Graphene is widely used for electrodes, sensors, and energy storage solutions due to its excellent mechanical and electrical characteristics. Although graphene has a 2D carbon sheet nanostructure, in practical applications it is used in three forms namely, flakes, films, and powders.
Among them, graphene in powder form exhibits low dispersibility in the solutions owing to its hydrophobic nature and tendency to stack and agglomerate by π bonds in the matrix. The low dispersibility of graphene can be addressed by oxidizing graphene.
Graphene oxide (GO) has hydrophilic properties induced by oxygen functional groups introduced between surfaces in the solution, which generates delamination between layers. Thus, to accurately determine the physical properties of GOs, it is necessary to precisely measure the thickness of GO.
Furthermore, it is difficult to determine the number of layers of GO which has a varying thickness depending on the various fabrication process conditions. Chemical vapor deposition (CVD) further deteriorates the crystallinity of processed GO, which causes graphene to lose its electrical characteristics.
Also, the more graphene oxidizes, the more density defects appear, which leads to chemical composition and structural changes. Thus, it is necessary to investigate the correlation between the thickness of GOs produced by various fabrication processes and the degree of oxidation.
About the Study
In this study, researchers used four types of GOs, named GO1 to GO4, with increasing degrees of oxidation to study the effect of different fabrication methods on their chemical composition, structural changes, and layer thickness. All samples were purified by dispersing in deionized (DI) water with different concentrations followed by centrifuging and drying.
Subsequently, they were spin-coated on the gold patterned SiO2/Si substrate for X-ray photoelectron spectroscopy (XPS). For the measurement of the thickness of layers, each sample IG/ISi ratio obtained with the help of silicon substrate was considered because the 2D peak of GO had an almost negligible intensity while measuring I2D/IG.
Further Reading: Using Graphene to Purify Seawater
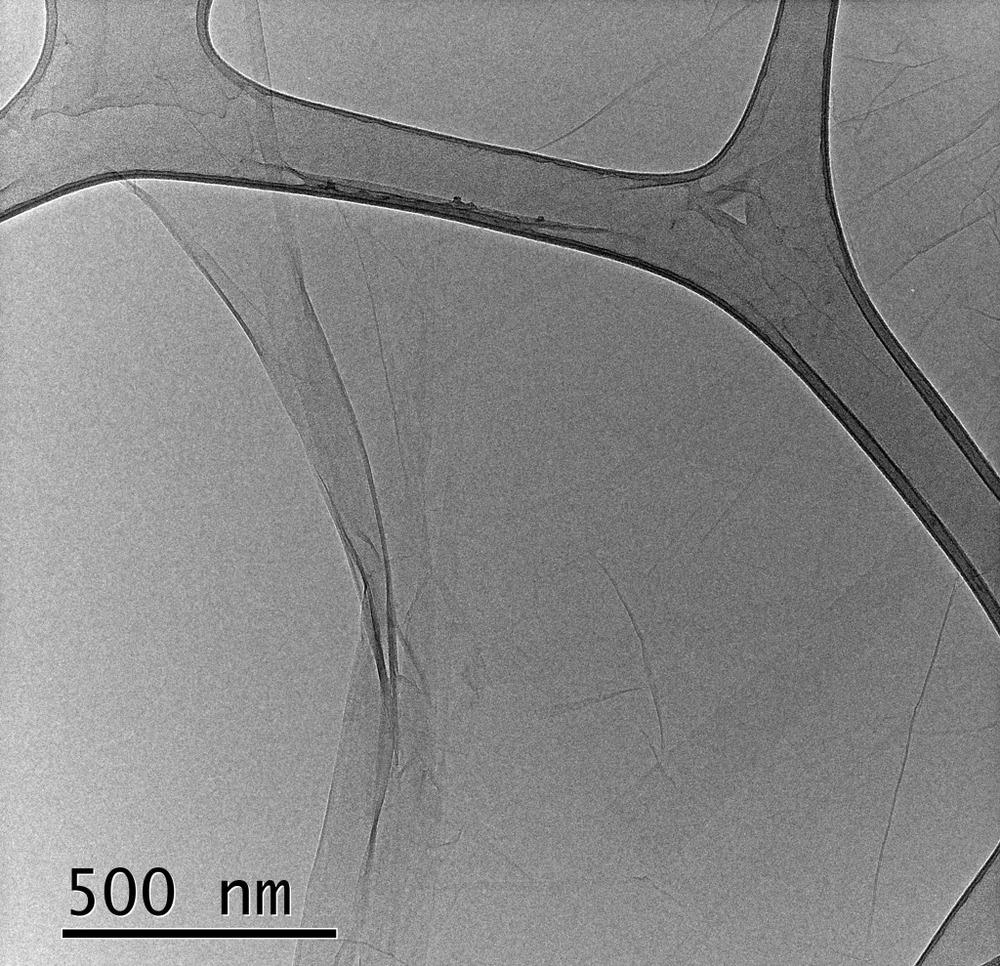
Moreover, the d-spacing was determined by X-ray diffraction (XRD) and transmission electron microscopy (TEM), and the content of oxygen functional groups was analyzed by XPS and Fourier infrared spectroscopy (FT-IR). Finally, atomic force microscopy (AFM) was used to examine the effect of the content of the oxygen functional groups on the monolayer thickness of each GO specimen.
Observations
The IR spectrum of GO showed peaks at 1731, 1626, 1381, 1232, and 1059 cm-1, which were associated with C=O, C=C, C-OH, C-O-C, and C-O bonds, respectively. The XPS C1s data of the SiO2 substrate and oxygen to carbon (O/C) ratio data showed that the degree of oxidation was the highest in GO 1 sample and decreased in the order of GO 1, GO 2, GO 3, and GO 4, as intended.
Moreover, the d-spacing obtained by XRD using the Bragg equation indicated that the d-spacing of (001) or (002) planes narrowed from GO 1 to GO 4 with values for GO 1 was 9.69 Å, and for GO 4 it was 6.65 Å. Also, the d-spacing was proportional to the degree of oxidation. However, it did not clarify whether the diffraction peaks obtained were from (001) planes or (002) planes. Subsequently, they compared the XRD diffraction peaks with the measured data from TEM images and concluded that the peaks were true of the (001) plane.
The AFM mapping images confirmed that the presence of the oxygen functional groups has a critical effect on increasing the thickness of GOs. However, the monolayer thickness of the GO on the silicon substrate gave a different value than the monolayer thickness of the GO on another GO layer. For GO 1 both values were 1.044 nm and 0.889 nm, respectively. Additionally, it was evident that the pH level of the solution had no significant effect on the thickness of GO monolayers.
Raman spectroscopy confirmed that the IG/ISi ratio is linearly proportional to the layer number and the degree of oxidation. It was indicated by the slopes of the curves with values 0.1136, 0.0590, 0.0541, and 0.0465 for GO 1, GO 2, GO 3, and GO 4, respectively.
Conclusions
In this study, researchers analyzed the effect of degree of oxidation and presence of oxygen functional groups on the chemical composition, structural changes, and thickness of four GO samples. They found that the thickness of GO varied depending on the O/C ratios, whereas the d-spacing of GO was proportional to the degree of oxidation.
The new approach to measure the d-spacing using gold patterned silicon substrate and IG/ISi ratio provided an effective correlation between the degree of oxidization and layer spacing of GO.
Reference
Park, J., Lee, W., Nam, J., Han, J., Choi, C., Hwang, J., A study of the correlation between the oxidation degree and thickness of graphene oxides, Carbon, 2022, ISSN 0008-6223, https://www.sciencedirect.com/science/article/pii/S0008622321012707?via%3Dihub
Disclaimer: The views expressed here are those of the author expressed in their private capacity and do not necessarily represent the views of AZoM.com Limited T/A AZoNetwork the owner and operator of this website. This disclaimer forms part of the Terms and conditions of use of this website.