Correlative Raman Imaging and Scanning Electron (RISE) Microscopy is a unique combination of scanning electron microscopy (SEM) and confocal Raman Imaging. This innovative correlative microscopy technique enables linking ultra-structural surface properties to molecular compound data, thus paving the way to more comprehensive sample characterization.
Scanning Electron Microscopy
Being a high resolution imaging technique, SEM is capable of determining the morphology and topography of a sample.
In this non-destructive method, the sample is scanned by a focused high-energy electron beam, causing the emergence of backscattered and secondary electrons due to electron-sample interactions. The detection of these electrons yields an image that reveals the surface structure, morphology, topography, and materials orientation of the sample.
The image acquisition is performed with nano- or micrometer resolutions and magnification ranges of 10–10,000x. The large depth of field facilitates the generation of a 3D appearance of the surface. SEM can be integrated with other imaging techniques.
Confocal Raman Imaging
Confocal Raman imaging is a non-destructive spectroscopic technique which analyzes molecular compounds in a sample, using the characteristic way different chemical bonds produce inelastic scattering of light.
The confocal Raman imaging technique involves integration of Raman spectroscopy and a confocal microscope, thereby enabling detection and imaging of the spatial distribution of the chemical components within a material.
Confocal Raman imaging can also analyze additional sample characteristics, such as crystallinity, stress and strain states, and the relative amount of a specific component. High-resolution confocal Raman microscopes acquire the data of a complete Raman spectrum at every image pixel and attain a lateral resolution at the diffraction limit (~200nm). With outstanding depth resolution, a confocal microscope configuration yields 3D Raman images and depth profiles.
RISE Microscopy
RISE microscopy has the advantages of both SEM and confocal Raman imaging in a single instrument. The sample can be transferred and re-positioned automatically in order to switch between the two measuring techniques.
The results obtained can be correlated and the images can be overlaid. SEM is often integrated with Energy Dispersive X-ray spectroscopy (EDX) to gain more insights into the chemical characteristics of a sample.
Unlike EDX, confocal Raman imaging is capable of detecting not only the chemical constituents but also the molecules and chemical compounds of a sample. Moreover, the spatial distribution of the constituents of a sample can be imaged.
RISE Microscopy Application Examples
A geological diorite sample was analyzed, without staining or fixing the sample before taking the measurement, using a RISE Microscope (from TESCAN and WITec, Figure 1).
The sample imaging was first performed in the SEM microscope mode for analysis of the surface structure (Figure 2a). Following the initial measurement, the sample was transferred and re-positioned automatically for confocal Raman imaging inside the electron microscope’s vacuum chamber. The same sample area was then captured in the Raman imaging mode.
Figure 1. RISE Microscope
A complete Raman spectrum characterization of the molecular composition was produced at each image pixel. The ultra-structure is compared with the molecular components (Figure 2b) by overlaying the acquired SEM and color-coded Raman images.
The corresponding Raman spectra are shown in Figure 1C. It is easier to identify each chemical compound from its characteristic Raman fingerprint.
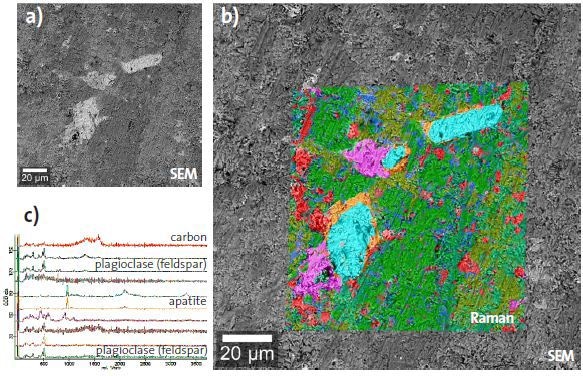
Figure 2. a) SEM Image of a geological diorite sample b) SEM image overlaid with the Raman image. c) The corresponding color- coded Raman spectra display each molecular component of the sample.
In the second application example, the RISE Microscope was used to analyze a hamster brain tissue sample. The SEM image clearly differentiates the white and gray brain matter through their structural differences.
A more detailed view of the distribution of the gray and white matter is obtained when the SEM is overlaid with the color-coded Raman image (Figure 3a). Both tissues can be readily differentiated by their characteristic Raman spectra (Figure 3a)
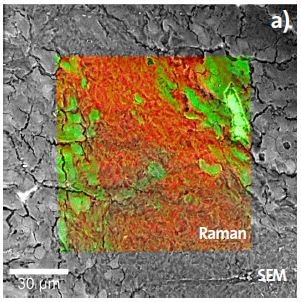
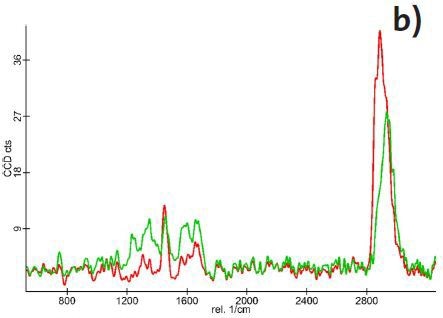
Figure 3. Raman-SEM image overlay of a hamster brain tissue sample. b) The corresponding Raman spectra reveal the different spectral characteristics of the white and gray brain matter.
Conclusion
The possibility of correlating ultra-structural surface with molecular compound data through RISE Microscopy paves way for a more comprehensive sample characterization.
With user friendliness and an unprecedented analytical advantage, RISE Microscopy is ideal for a myriad of applications such as life science, geosciences, polymer science, nanotechnology, surface and materials science, and pharmaceuticals.

This information has been sourced, reviewed and adapted from materials provided by WITec GmbH.
For more information on this source, please visit WITec GmbH.