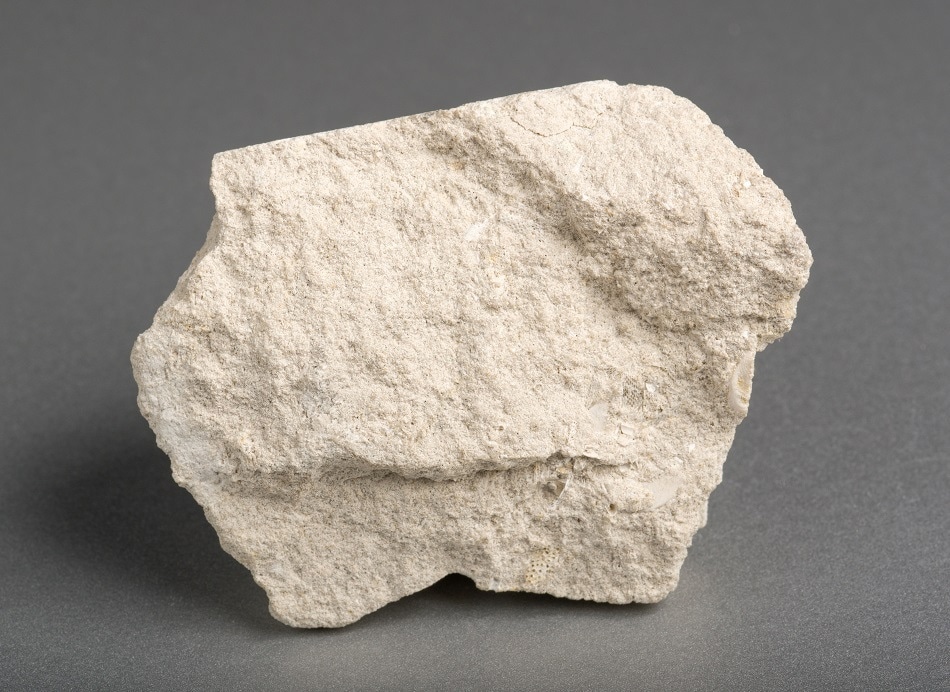
Limestone (CaCO3) is an inorganic mineral that occurs abundantly in nature. It is mined, crushed and processed to suit specific end-use applications. In general, two types of lime are produced: one with a high calcium and magnesium content called dolomitic lime (MgO•CaO) and the other with a high calcium content called high calcium (CaO).

Image Credits: shutterstock.com/Aleksandr Pobedimskiy
Using inductively coupled plasma coupled with optical emission spectrometry (ICP-OES) to determine metals in lime samples is not a complex process as such, but would involve multiple steps if acid digestion processes are being considered. A single approach that includes all raw, waste and finished products involved in the lime production process would present a viable option as it will help boost uptime and productivity.
This article elucidates the automated borate fusion method that can be applied to achieve complete dissolution of lime products such as calcium hydroxide, dolomite, limestone, and residues without the need for hazardous acids or costly sample dissolution for ICP-OES determination.
Experimental Framework
Sample Preparation
Borate fusions can be carried out either manually or with automated systems. While both techniques are efficient, the automated systems provide a better option as they improve safety, boost productivity, and maintain repeatable preparation conditions.
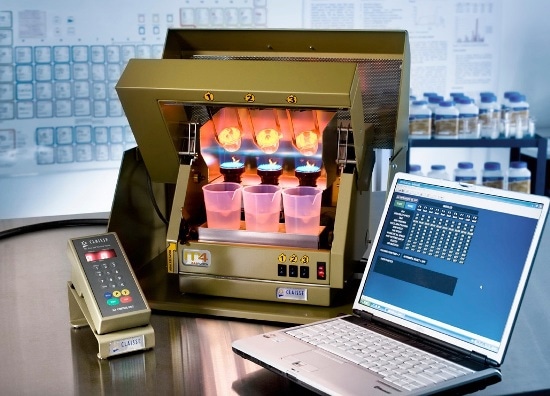
These factors help prevent spattering and cross-contamination. In this study, fusions were carried out by means of the Claisse® M4™ Fluxer (Figure 1). This 3 burner fusion instrument enables safe, fast, and complete dissolution of the relevant samples.

Figure 1. Claisse® M4™ Fluxer
The instrument also provides inter-burner flame stability for optimum consistency and repeatability. The software enables complete control across a wide range of operating parameters such as temperature, speed of agitation, and duration of each step, amongst others.
Using the adjustable parameters, users can easily optimize the fusion process to achieve total dissolution of the samples as quickly as possible. Different reference materials and samples were employed to verify the developed method, as shown in Table 1.
Table 1. List of reference materials and samples used to validate the developed method
| Sample |
Supplier |
| Certified Reference Material – Dolomite ( SRM 88b ) |
NIST |
| Certified Reference Material - Limestone ( ECRM701-1 ) |
Techlab |
| Limestone sample ( #505 ) |
Lime industry |
| Dolomite sample ( # 506 ) |
Lime industry |
| CaOH sample ( # 507 ) |
Lime industry |
| CaO sample ( #508 ) |
Lime industry |
| Lime Kiln Dust ( Residues – LKD ) ( # 509 ) |
Lime industry |
Using a platinum-gold (95%/5%) flat-bottomed Claisse® crucible, 0.35g of finely-ground sample measuring less than 100µm was mounted in a muffle furnace and ashed at 1100oC temperature for a period of 2h. It was then combined with and 2.0g of 66,67% lithium tetraborate/32,83% lithium metaborate/0,5 % lithium bromide flux (67/33/LiBr) and 0.2g of Ammonium Nitrate (NH4NO3).
Following this, the Claisse® crucible containing the mixture was placed on the Claisse® M4™ fusion instrument, fused for a period of 6 minutes, and then finally poured into a Teflon® Beaker, which included approximately 90mL of HNO3/HCl (10 %v/v) solution.
This solution was magnetically agitated for 5 minutes. Next, the content in the Teflon®beakers was diluted and an aliquot was transferred to a 100mL flask, bringing up to volume by means of the acid solution. The solution was finally brought to the ICP-OES for analysis.
Instrumentation
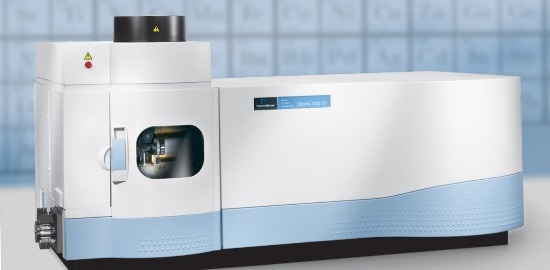
The PerkinElmer® Optima™ 7300 DV ICP-OES instrument (Figure 2) was used to perform all the measurements. It is equipped with the WinLab32™ for ICP Version 4.0 software. The ICP torch is mounted in a horizontal direction in the shielded torch box of this instrument, but this can be observed either radially or axially.

Figure 2. PerkinElmer® Optima™ 7300 DV ICP-OES
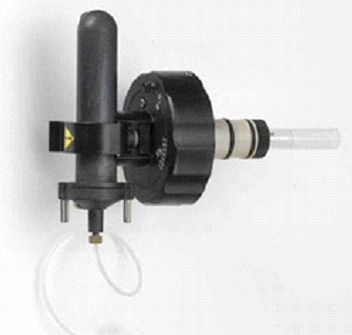
Also, as an introduction system, a Scott Spray Chamber with Gem Tip Cross Flow Nebulizer(Figure 3) was used as it is capable of handling high dissolved solids and has excellent reliability and robustness.
A shear gas flow prevents the cool plasma tail and helps in observing the normal analytical zone of the plasma. This minimizes the effects of chemical matrix when the axial-view mode is utilized.

Figure 3. Scott Spray Chamber with Gem Tip Cross Flow Nebulizer
When integrated with an Echelle optical system and a SCD detector, the Optima™ 7300 DV ICP-OES system is capable of measuring all the wavelengths concurrently. Thanks to its flexibility, end users can easily include new wavelengths or elements as and when their programs change.
In addition, a 40MHz free-running solid state RF generator in the Optima™ has been specifically designed to operate from 750 to 1500W in 1W increments. A strong plasma is needed for precise analysis of borate fusion samples (Table 2) and for this purpose a high RF power is required. Table 2 shows the detailed operating parameters for the Optima™ 7300 DV system.
Table 2. Optima™ 7300 DV operating parameters
| Nebulizer |
Gem Tip Cross flow |
| Spray Chamber |
Scott |
| Injector |
Alumina |
| RF |
1500 W |
| Argon Flow rate |
Plasma : 16,0 L/min Nebulizer : 0,8 L/min Auxiliary : 0,4 L/min |
| Shear gas |
100 psi |
| Sample flow rate |
1,0 mL/min |
Results and Discussion
The following factors were considered when choosing the wavelength:
- The freedom from spectral interferences
- The different sensitivities and anticipated concentration in the samples
In order to remain in the linear range and to prevent spectral interferences, the most sensitive line was not always utilized. Observed interferences were off-set by changing the processing parameters.
Method detection limits (MDLs) were based on 10 replicate measurements of a sequence of diluted sample solutions. The MDL was determined by multiplying the standard deviation of the 10 replicate measurements by 3 and the correction factor as follows:
MDL = 3 x S10 x CDF
Where S10 is the standard deviation of the 10 replicates, and CDF is the Corrected Dilution Factor.
Table 3. Analytes of interest with selected wavelengths, method detection limits (MDLs) and viewing modes
| Element |
Wavelength |
Viewing mode |
MDL ( mg/Kg ) |
| Al |
396,153 |
Axial |
3 |
| Ca |
227,546 |
Radial |
125 |
| Fe |
238,204 |
Axial |
3 |
| Mg |
279,077 |
Axial |
25 |
| Mn |
259,372 |
Axial |
1 |
| Si |
288,158 |
Axial |
6 |
| Ti |
368,519 |
Axial |
1 |
Table 3 shows the relevant analytes with selected wavelengths, viewing modes, and MDLs.The precision and accuracy of the method was then assessed. The precision was ascertained by preparing and quantifying 10 replicates of various certified reference materials (CRMs), while the accuracy was ascertained by measuring the elemental recovery of CRMs.
Tables 4 and 5 show the results obtained for each CRM. The precision and accuracy thus achieved show that the developed method performed extremely well.
Table 4. Accuracy and precision measurements on Techlab ECRM 701-1 (Limestone)
| Element |
Wavelength |
Average Experimental values( % ) n = 10 |
Certified values( % ) |
Accuracy( % ) |
Precision( % ) |
| Al |
396,153 |
0,29 |
0,29 |
99 |
3 |
| Ca |
227,546 |
38,2 |
37,7 |
102 |
4 |
| Fe |
238,204 |
0,69 |
0,73 |
95 |
3 |
| Mg |
279,077 |
0,37 |
0,36 |
102 |
3 |
| Mn |
259,372 |
0,02 |
0,02 |
98 |
3 |
| Si |
288,158 |
0,95 |
0,93 |
102 |
3 |
| Ti |
368,519 |
0,02 |
0,02 |
103 |
3 |
Corrected dilution factor = 571
Table 5. Accuracy and precision measurements on NIST SRM 88b (Dolomite)
| Element |
Wavelength |
Average Experimental values( % ) n = 10 |
Certified values( % ) |
Accuracy( % ) |
Precision( % ) |
| Al |
396,153 |
0,18 |
0,18 |
104 |
1 |
| Ca |
227,546 |
21,1 |
21,4 |
98 |
1 |
| Fe |
238,204 |
0,19 |
0,19 |
99 |
1 |
| Mg |
279,077 |
12,8 |
12,7 |
101 |
1 |
| Mn |
259,372 |
0,01 |
0,01 |
115 |
1 |
| Si |
288,158 |
0,52 |
0,53 |
99 |
3 |
| Ti |
368,519 |
0,01 |
- |
- |
1 |
Corrected dilution factor = 571
Pre-fusion spikes were carried out on CRMs and samples (Table 6) to check the accuracy of the elemental recoveries and also to verify the developed method.
Table 6. Recovery results on pre-fusion spikes (n = 5)
| Element |
Wavelength |
#505 ( % ) |
#506 ( % ) |
#507 ( % ) |
#508 ( % ) |
#509 ( % ) |
ECRM 701-1 ( % ) |
SRM 88b ( % ) |
| Al |
396,153 |
114 |
103 |
104 |
112 |
95 |
103 |
101 |
| Ca |
227,546 |
102 |
92 |
103 |
88 |
95 |
95 |
91 |
| Fe |
238,204 |
100 |
76 |
90 |
85 |
92 |
67 |
91 |
| Mg |
279,077 |
104 |
91 |
88 |
90 |
89 |
87 |
91 |
| Mn |
259,372 |
95 |
98 |
91 |
91 |
93 |
96 |
97 |
| Si |
288,158 |
99 |
80 |
96 |
92 |
86 |
91 |
93 |
| Ti |
368,519 |
108 |
99 |
94 |
92 |
93 |
100 |
101 |
Comments:
• Spike concentration = 50 to 100 % more than the concentrations in the samples and CRM solutions ( correction factor : 1143 ).
• If concentrations < MDL, addition of ±10 times the MDL value.
Conclusion
Borate fusions coupled with the Optima™ 7300 DV (simultaneous ICP-OES) have the preferred analytical capabilities to carry out the analysis of common lime products, such as dolomite and limestone, with excellent analysis speed, precision, accuracy, recovery, and robustness. They are able to meet the needs specified for analysis of fusion samples and other similar high matrix samples.
Metal components determined in various reference materials and samples show excellent accuracy. Therefore, the borate fusion method provides a suitable solution for complete dissolution of lime products. This automated method is fast, simple, and easy to use. In addition, it does not require highly skilled operators and eliminates the use of harsh acids.

This information has been sourced, reviewed and adapted from materials provided by Claisse.
For more information on this source, please visit Claisse.